Look Closer
A visualization bringing individual identities to the human cost of mass shootings in America.
- Medium
- Conceptual data visualization
- Year
- 2018
- Form
- Physical prototype, e-paper proof of concept and this page
- Status
- Prototype, ongoing
- Data
- The Violence Project Mass Shooter Database, Version 10
1,404 names
Between 1966 and 2025, 1,404 people were killed in 197 mass public shootings in the United States. These are their names, in the order they were taken.
Scroll to move through time. Hover over or select a name to learn more about the person.
The idea
Since the 1966 University of Texas tower shooting, 197 mass public shootings have killed 1,404 people in the United States. Each one leads the news for a few days, until the next one takes its place.
Most of these shootings have no clear motive and no tie to gangs or other crime. People are killed at school, at work, at the cinema and at church, at random, and children are among them. The total keeps rising, and the names fade much faster than the numbers grow.
Objective
I wanted a piece that stops people, stays with them, and makes the toll impossible to file away as a statistic. It had to inform as well as move, and work in different settings: a gallery wall, a public space, a screen.
Approach
I compiled a chronological list of everyone killed, starting with the 1966 tower shooting, and set their names in small red type, packed into the shape of blood soaking through clothing. From across the room the piece reads as a wound. Up close, every mark is a name.
Physical prototype
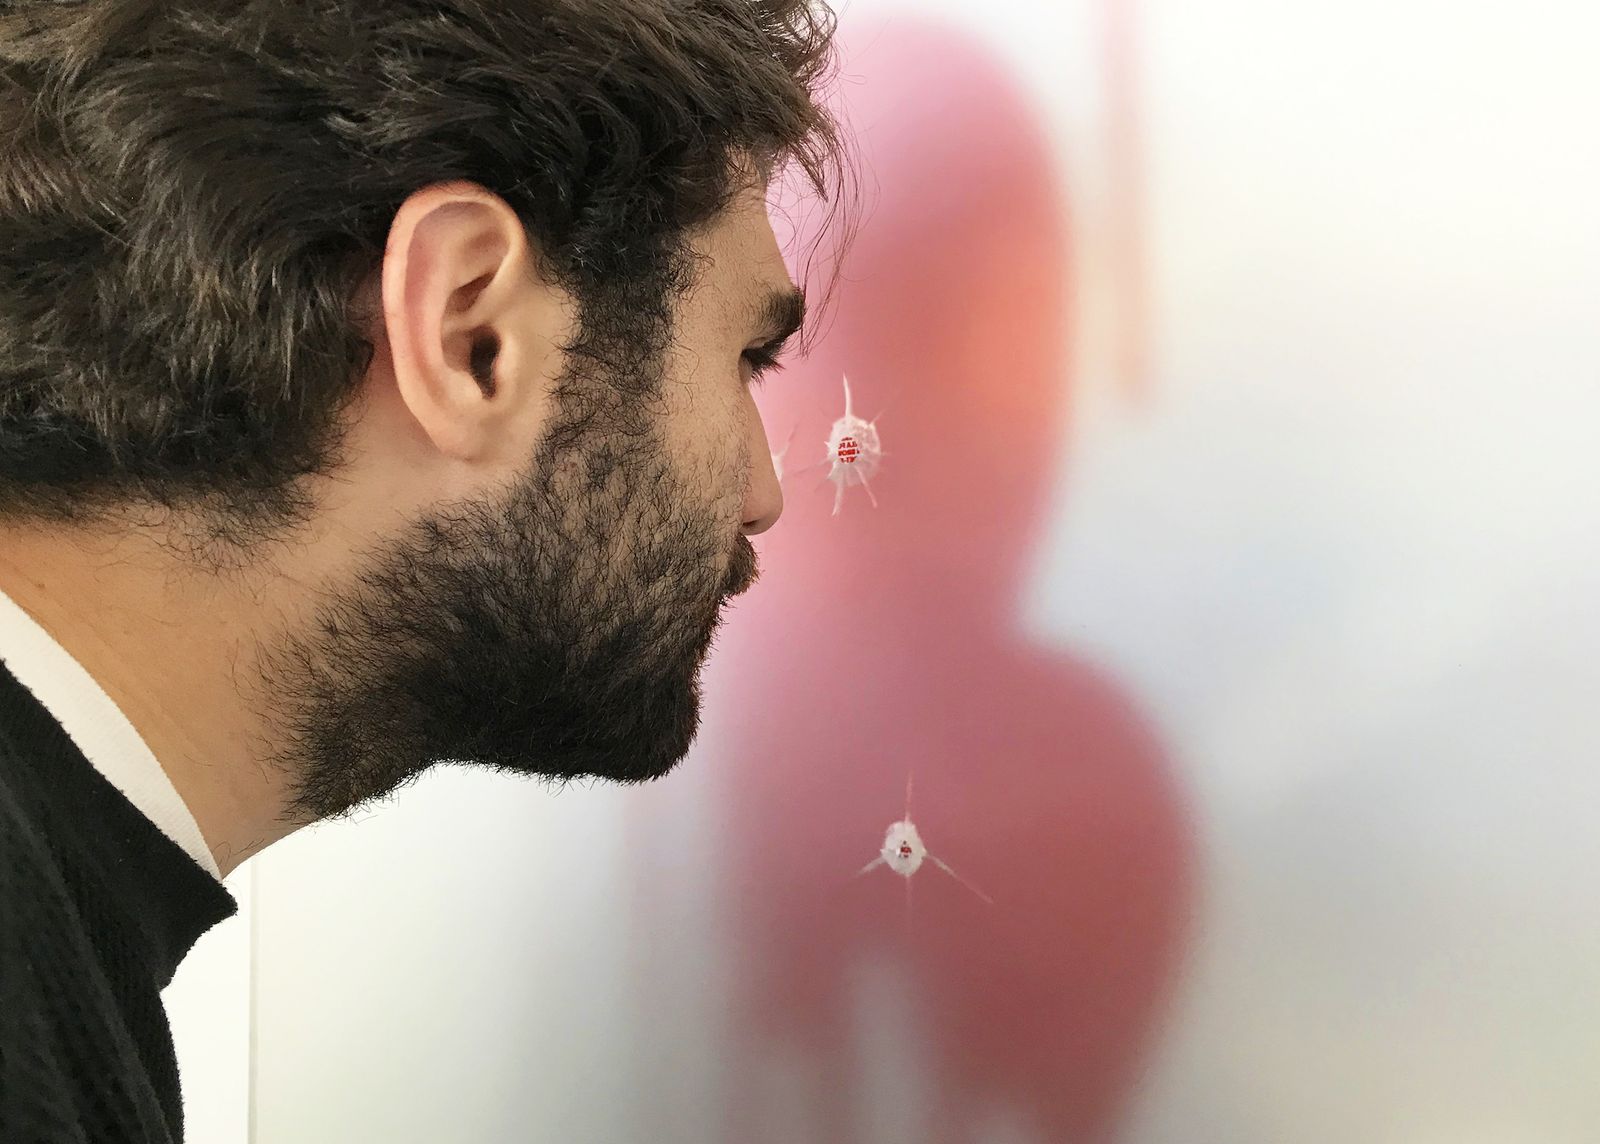
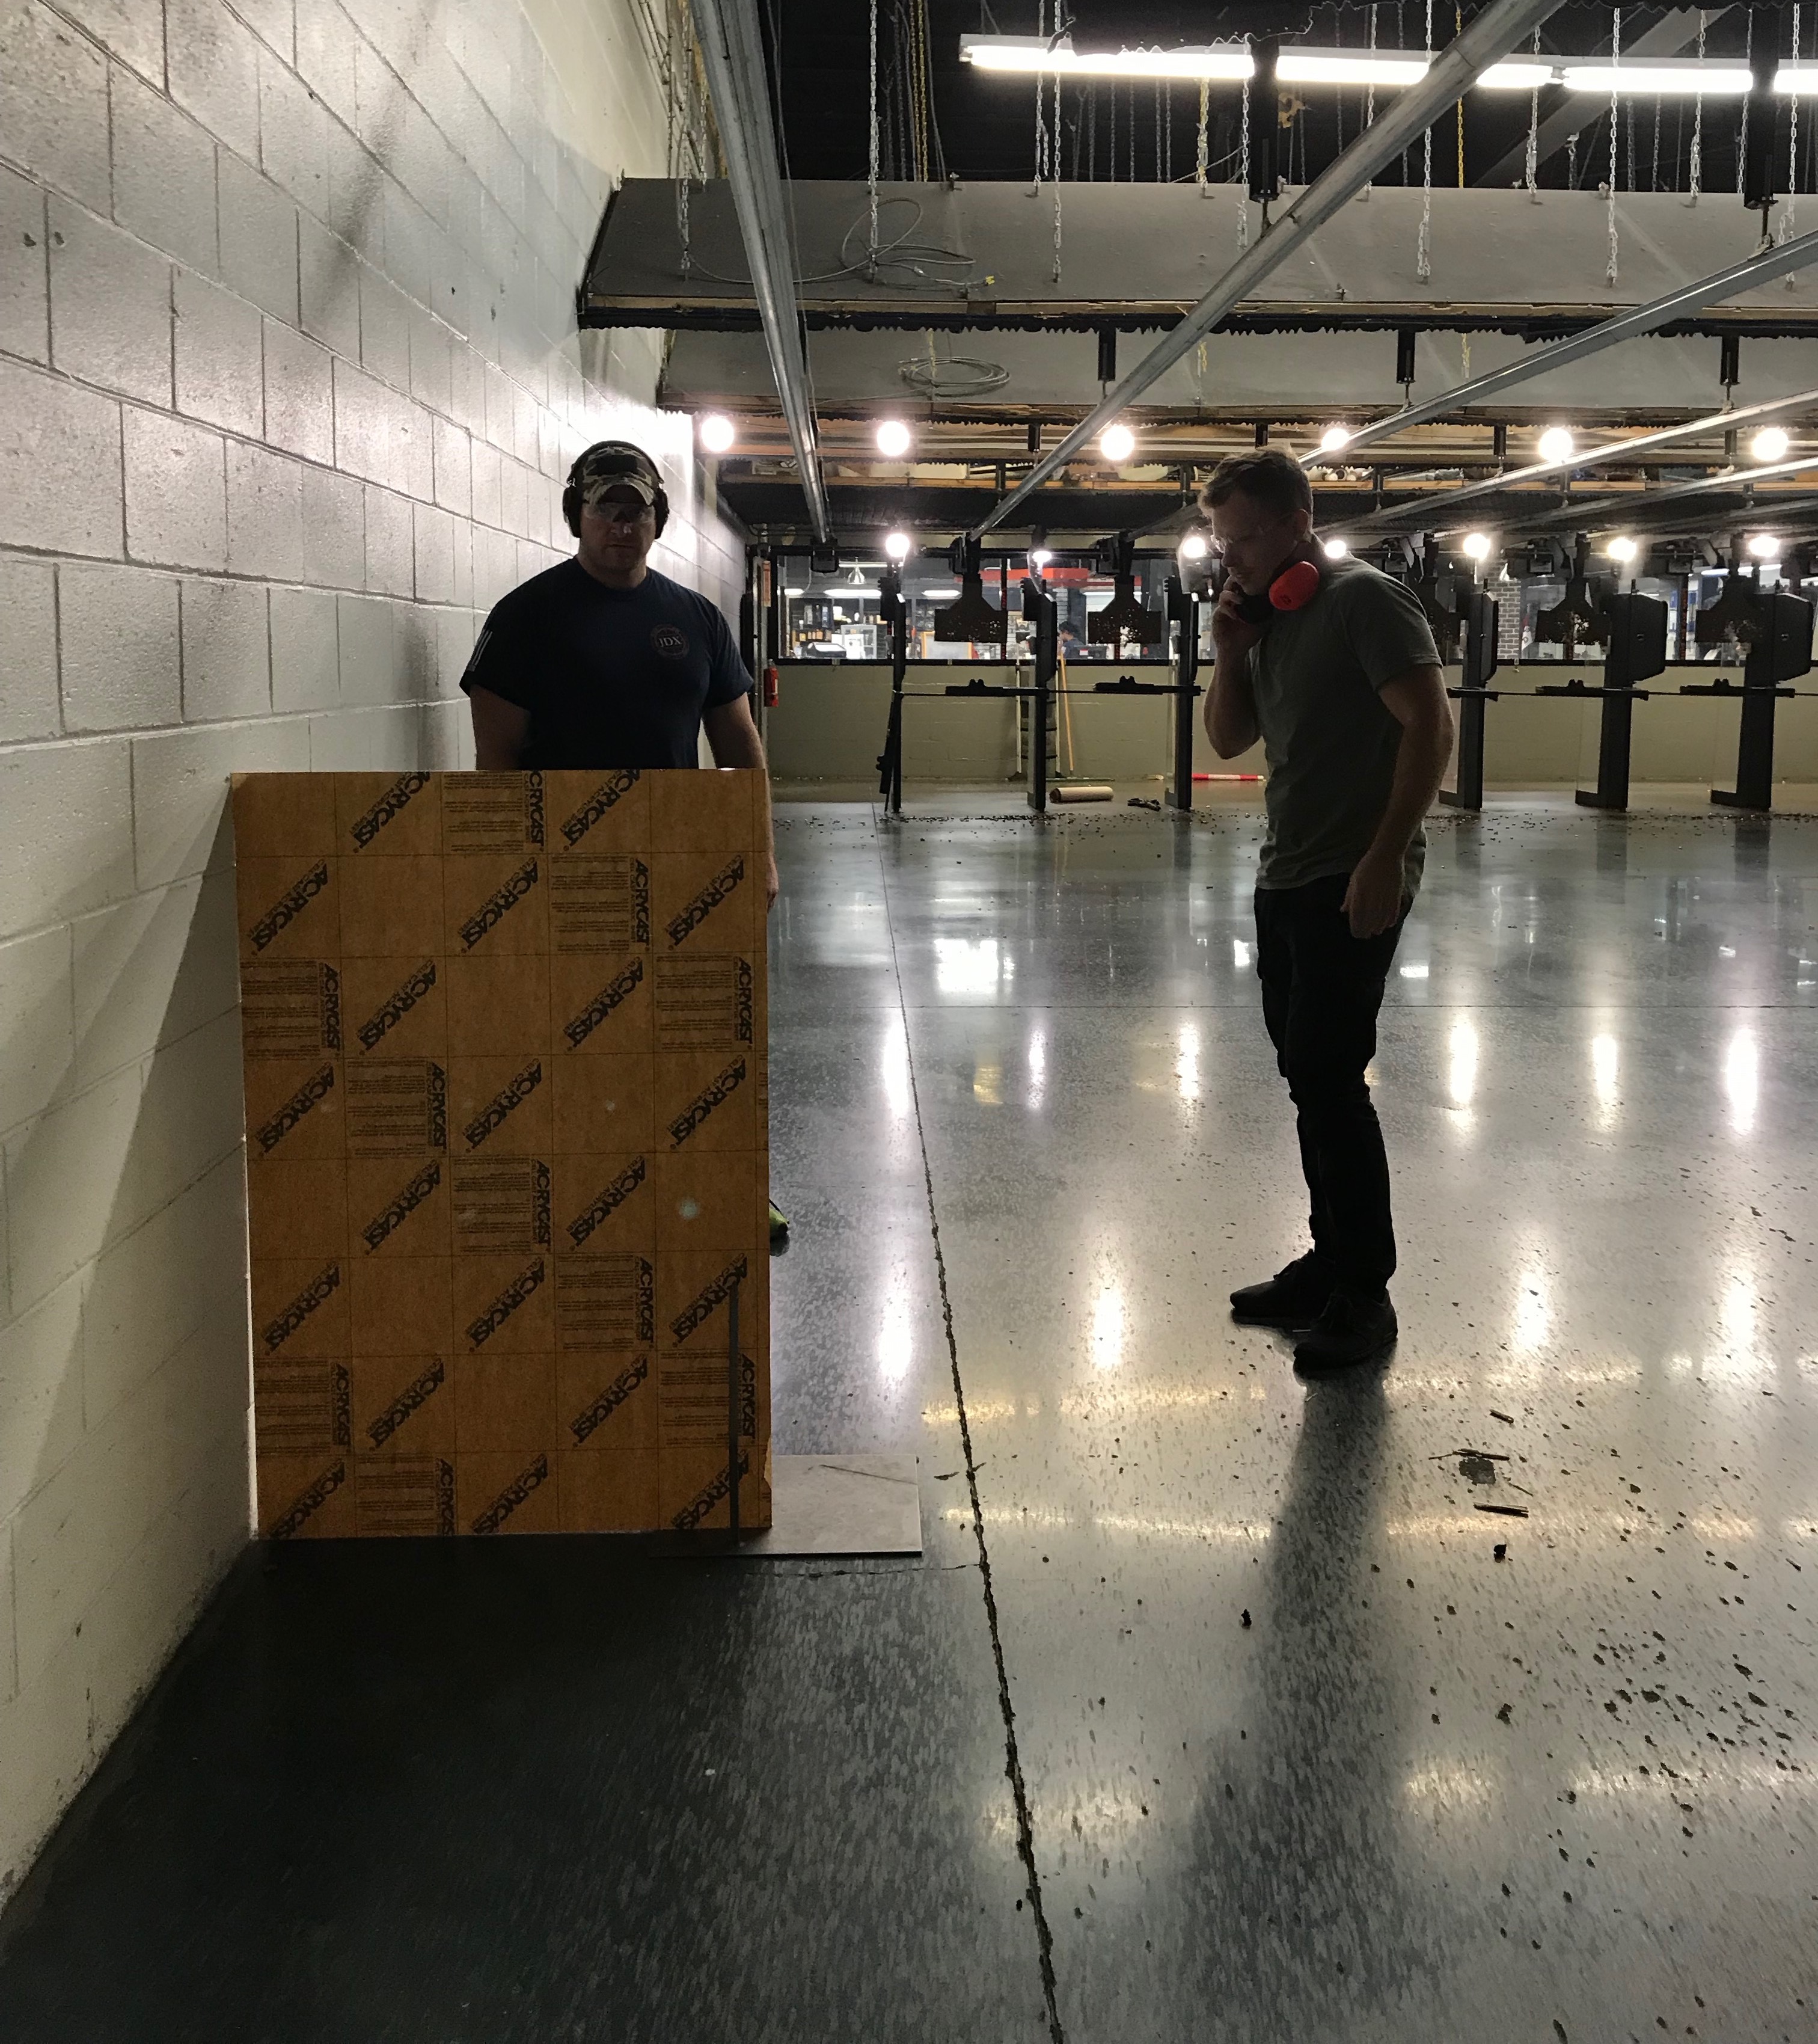
The first version is a print of the names behind a sheet of frosted acrylic that was shot through with real bullets.
Making the bullet holes
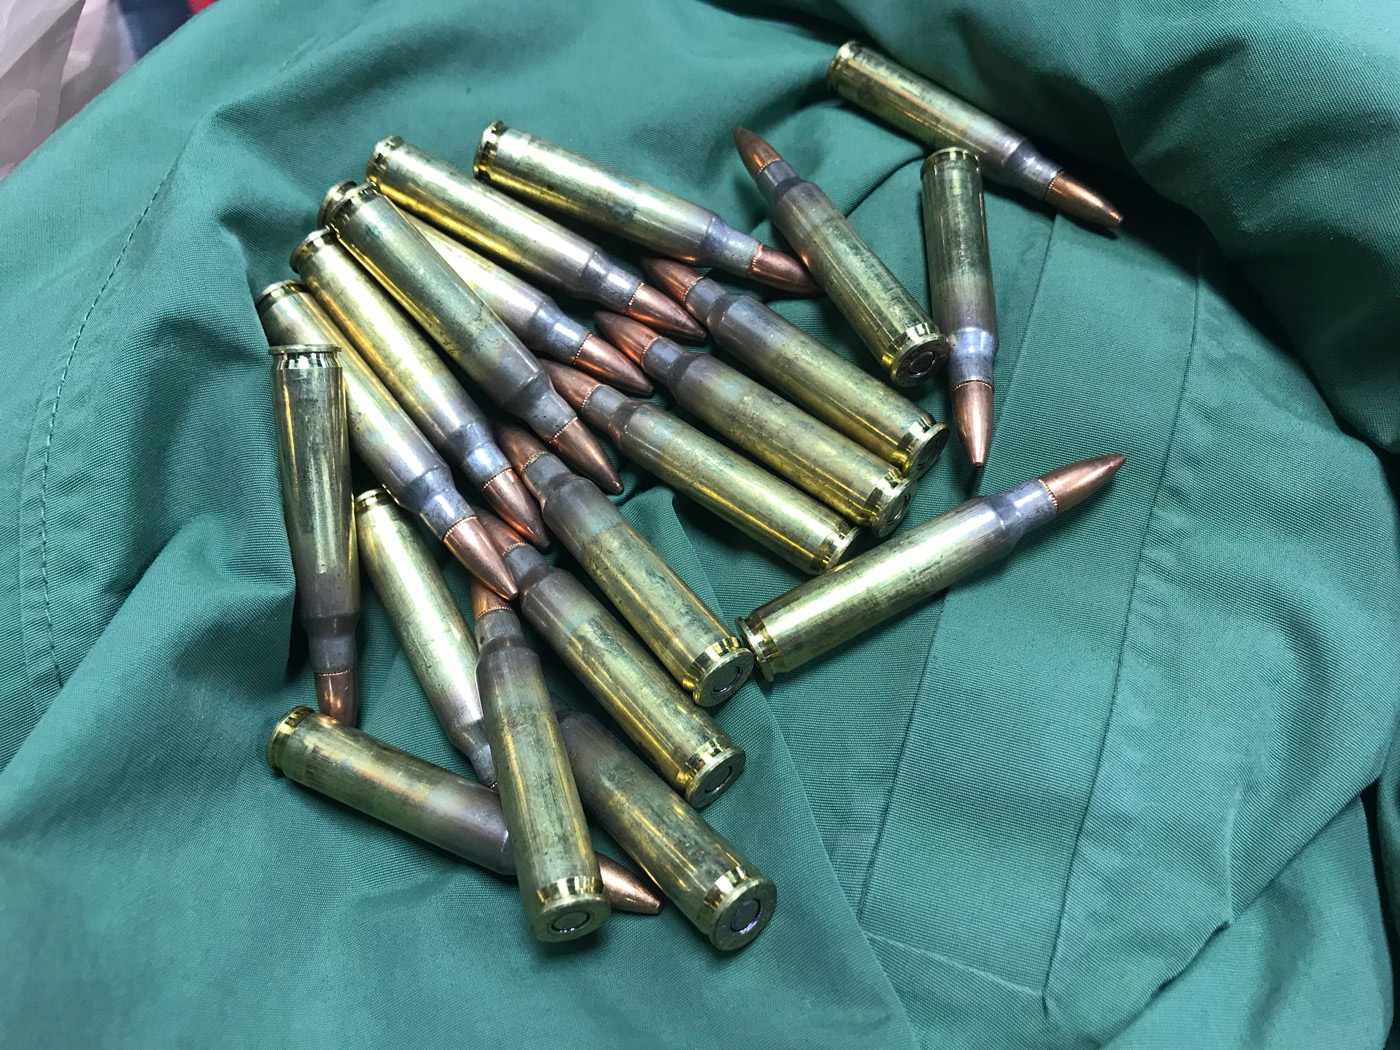
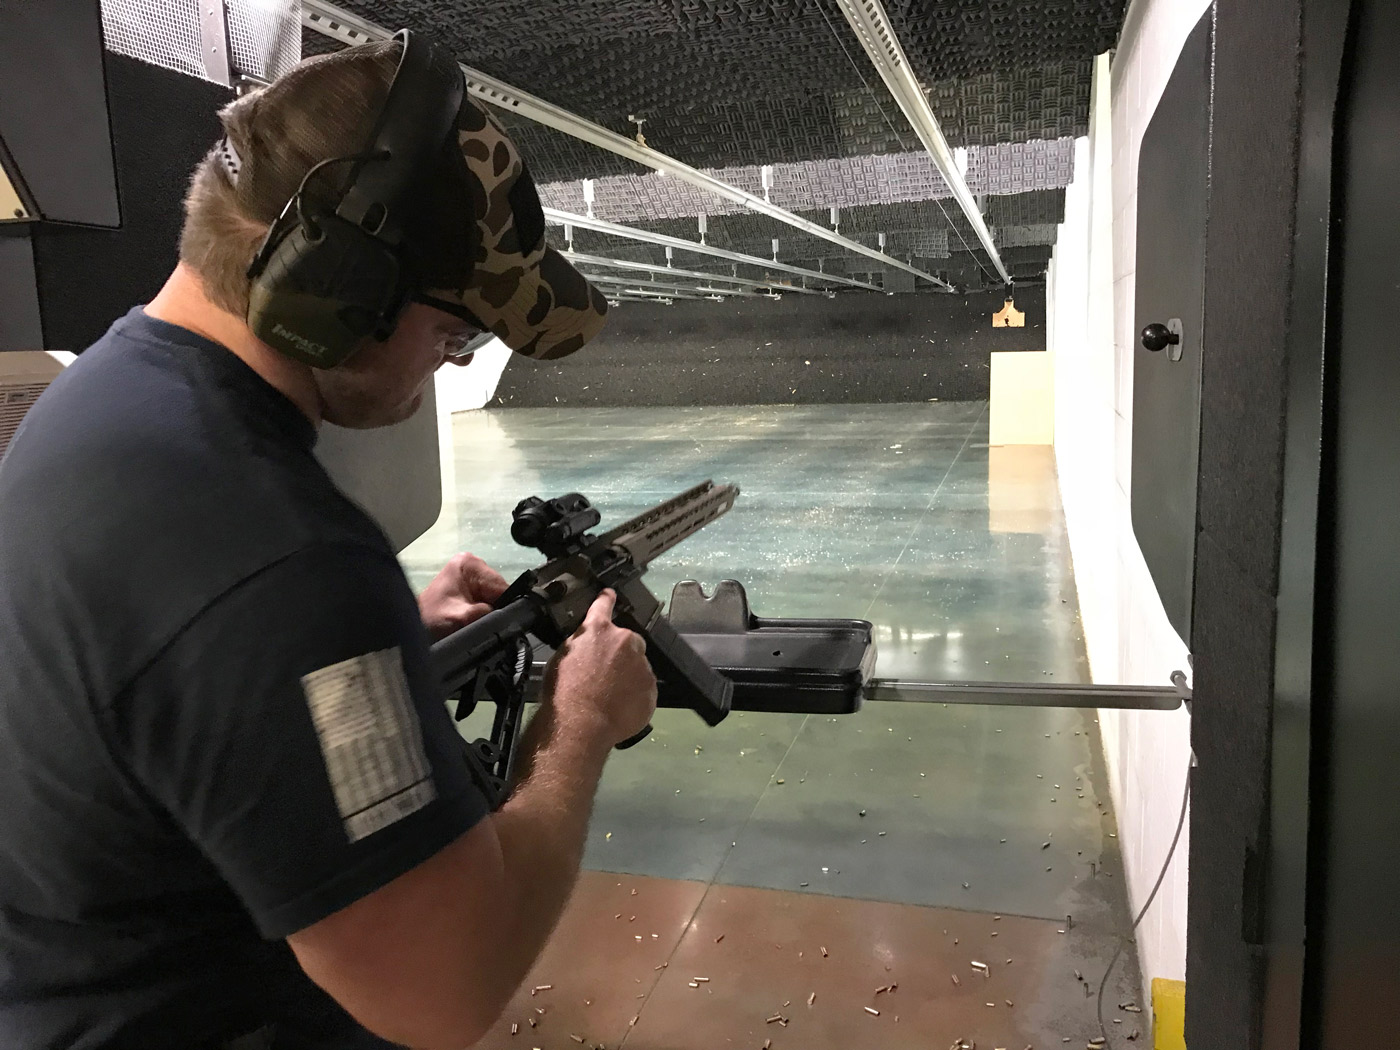
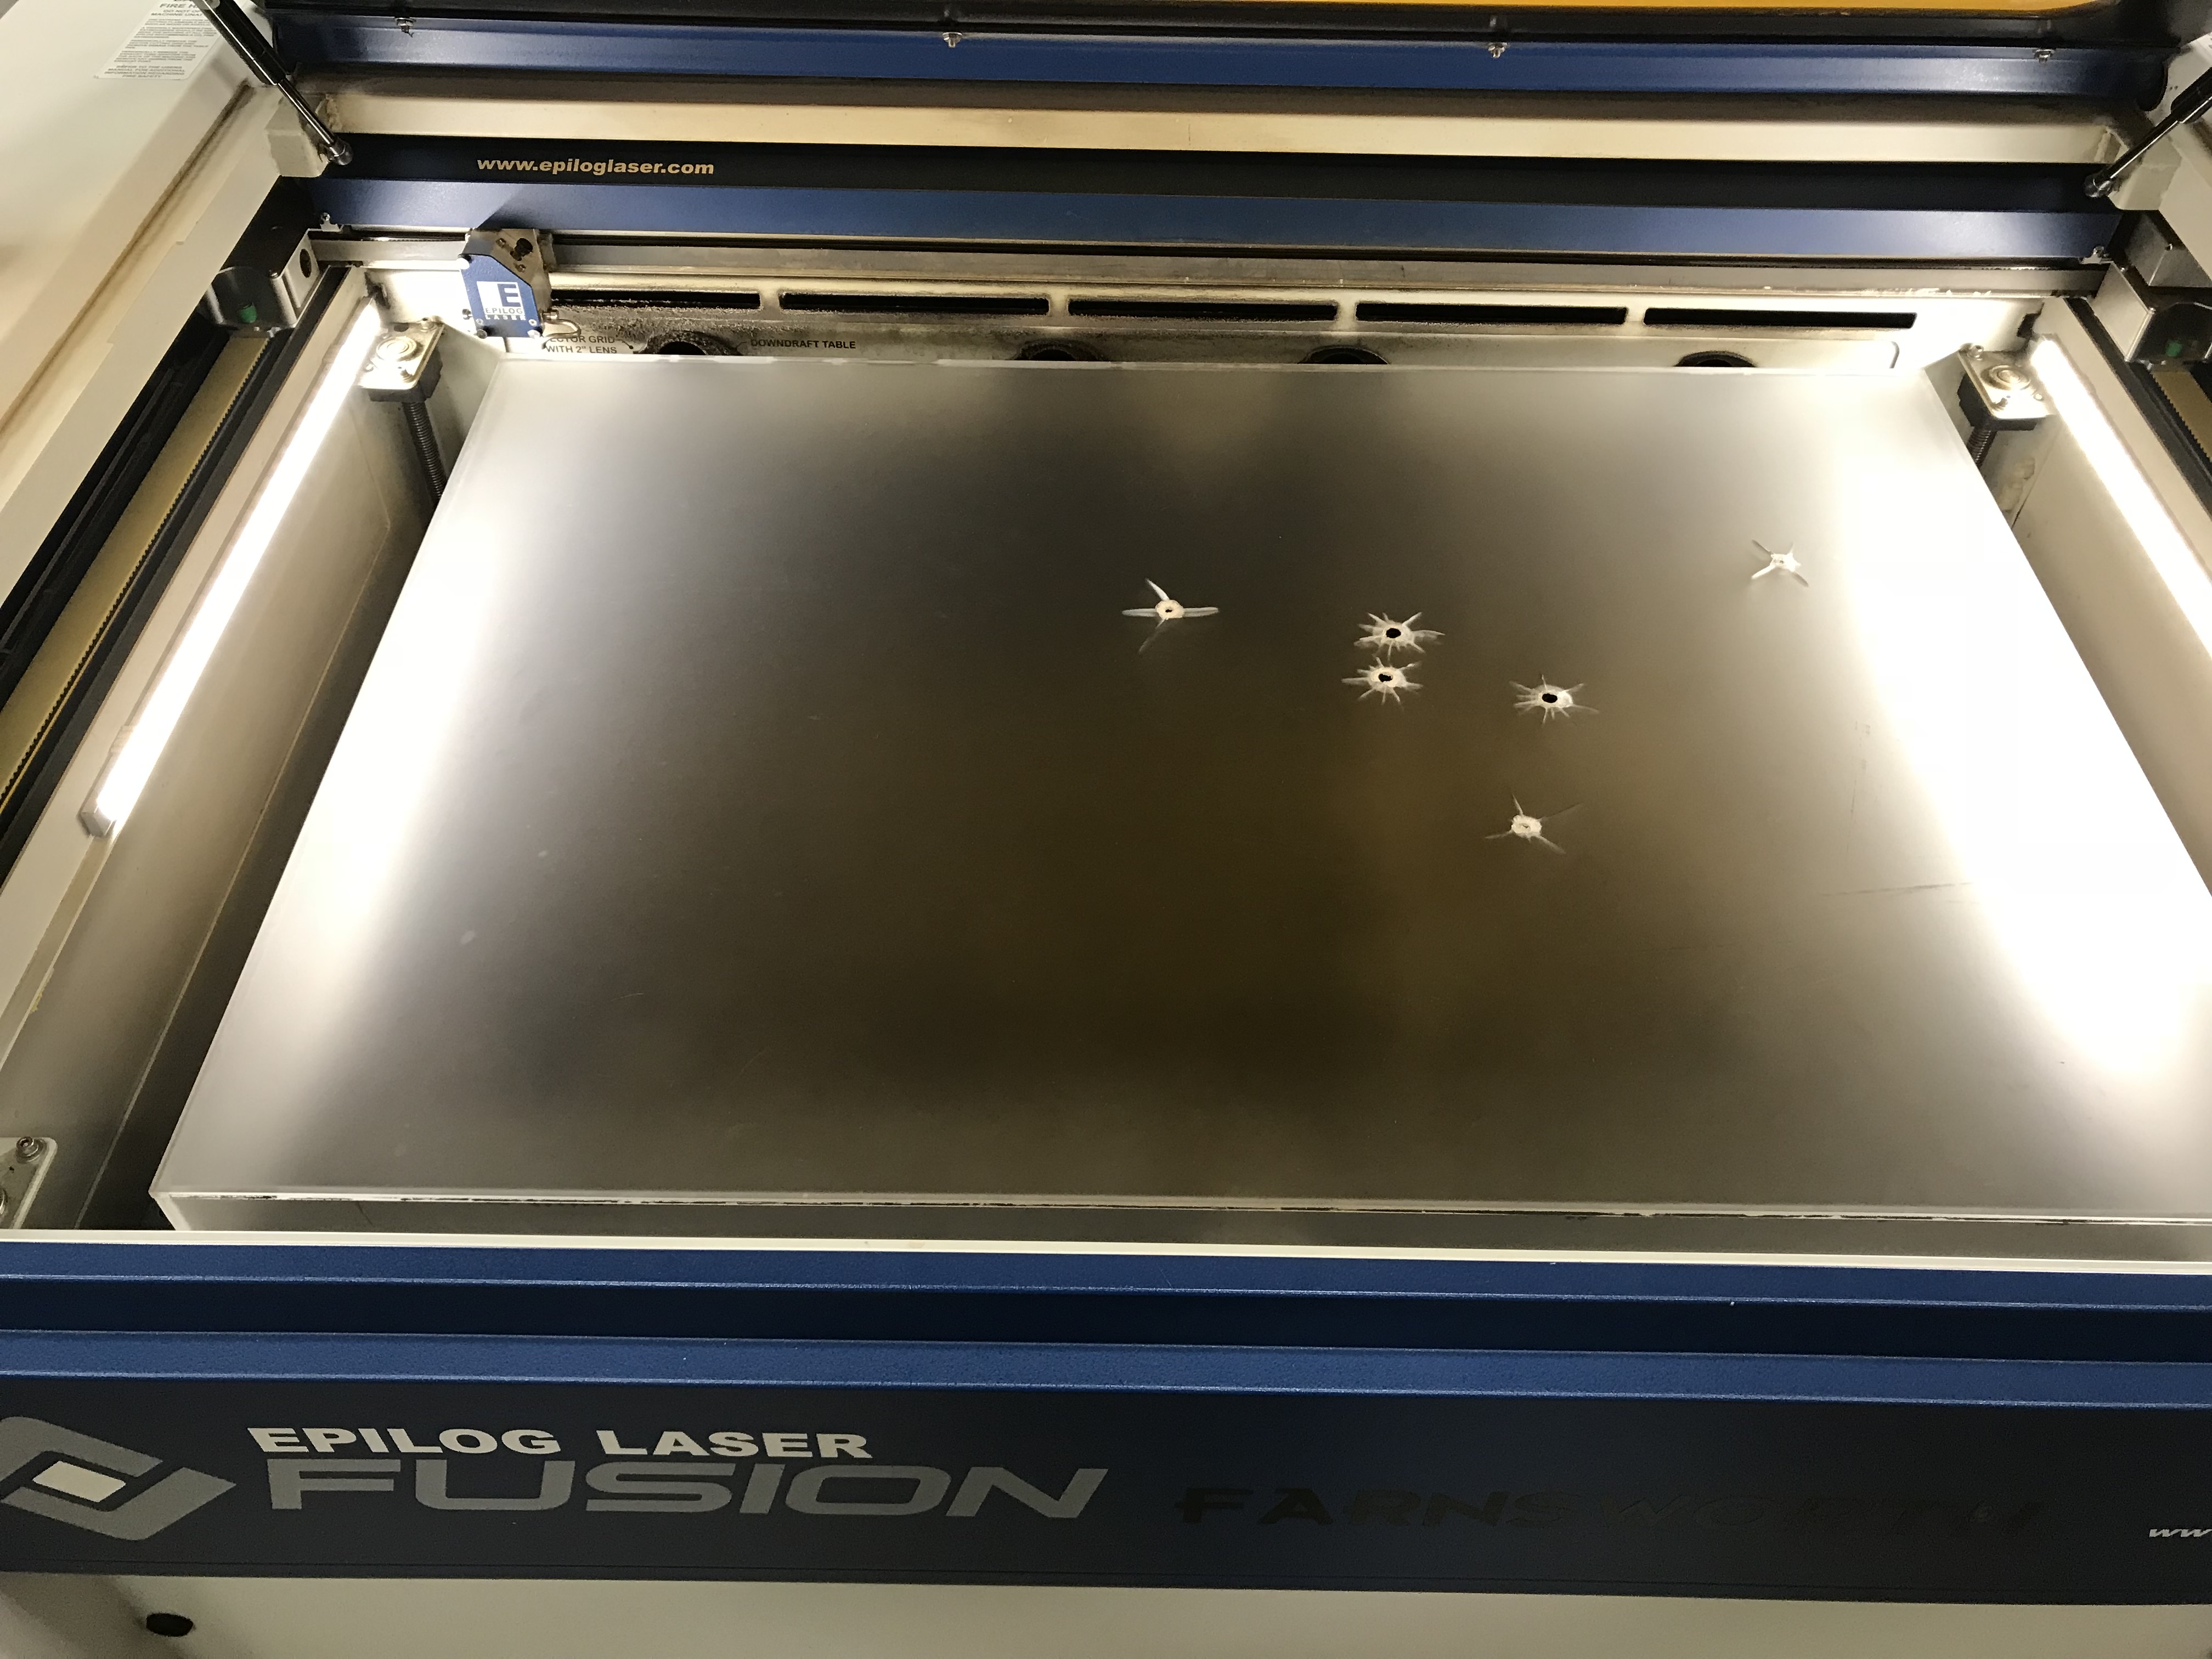
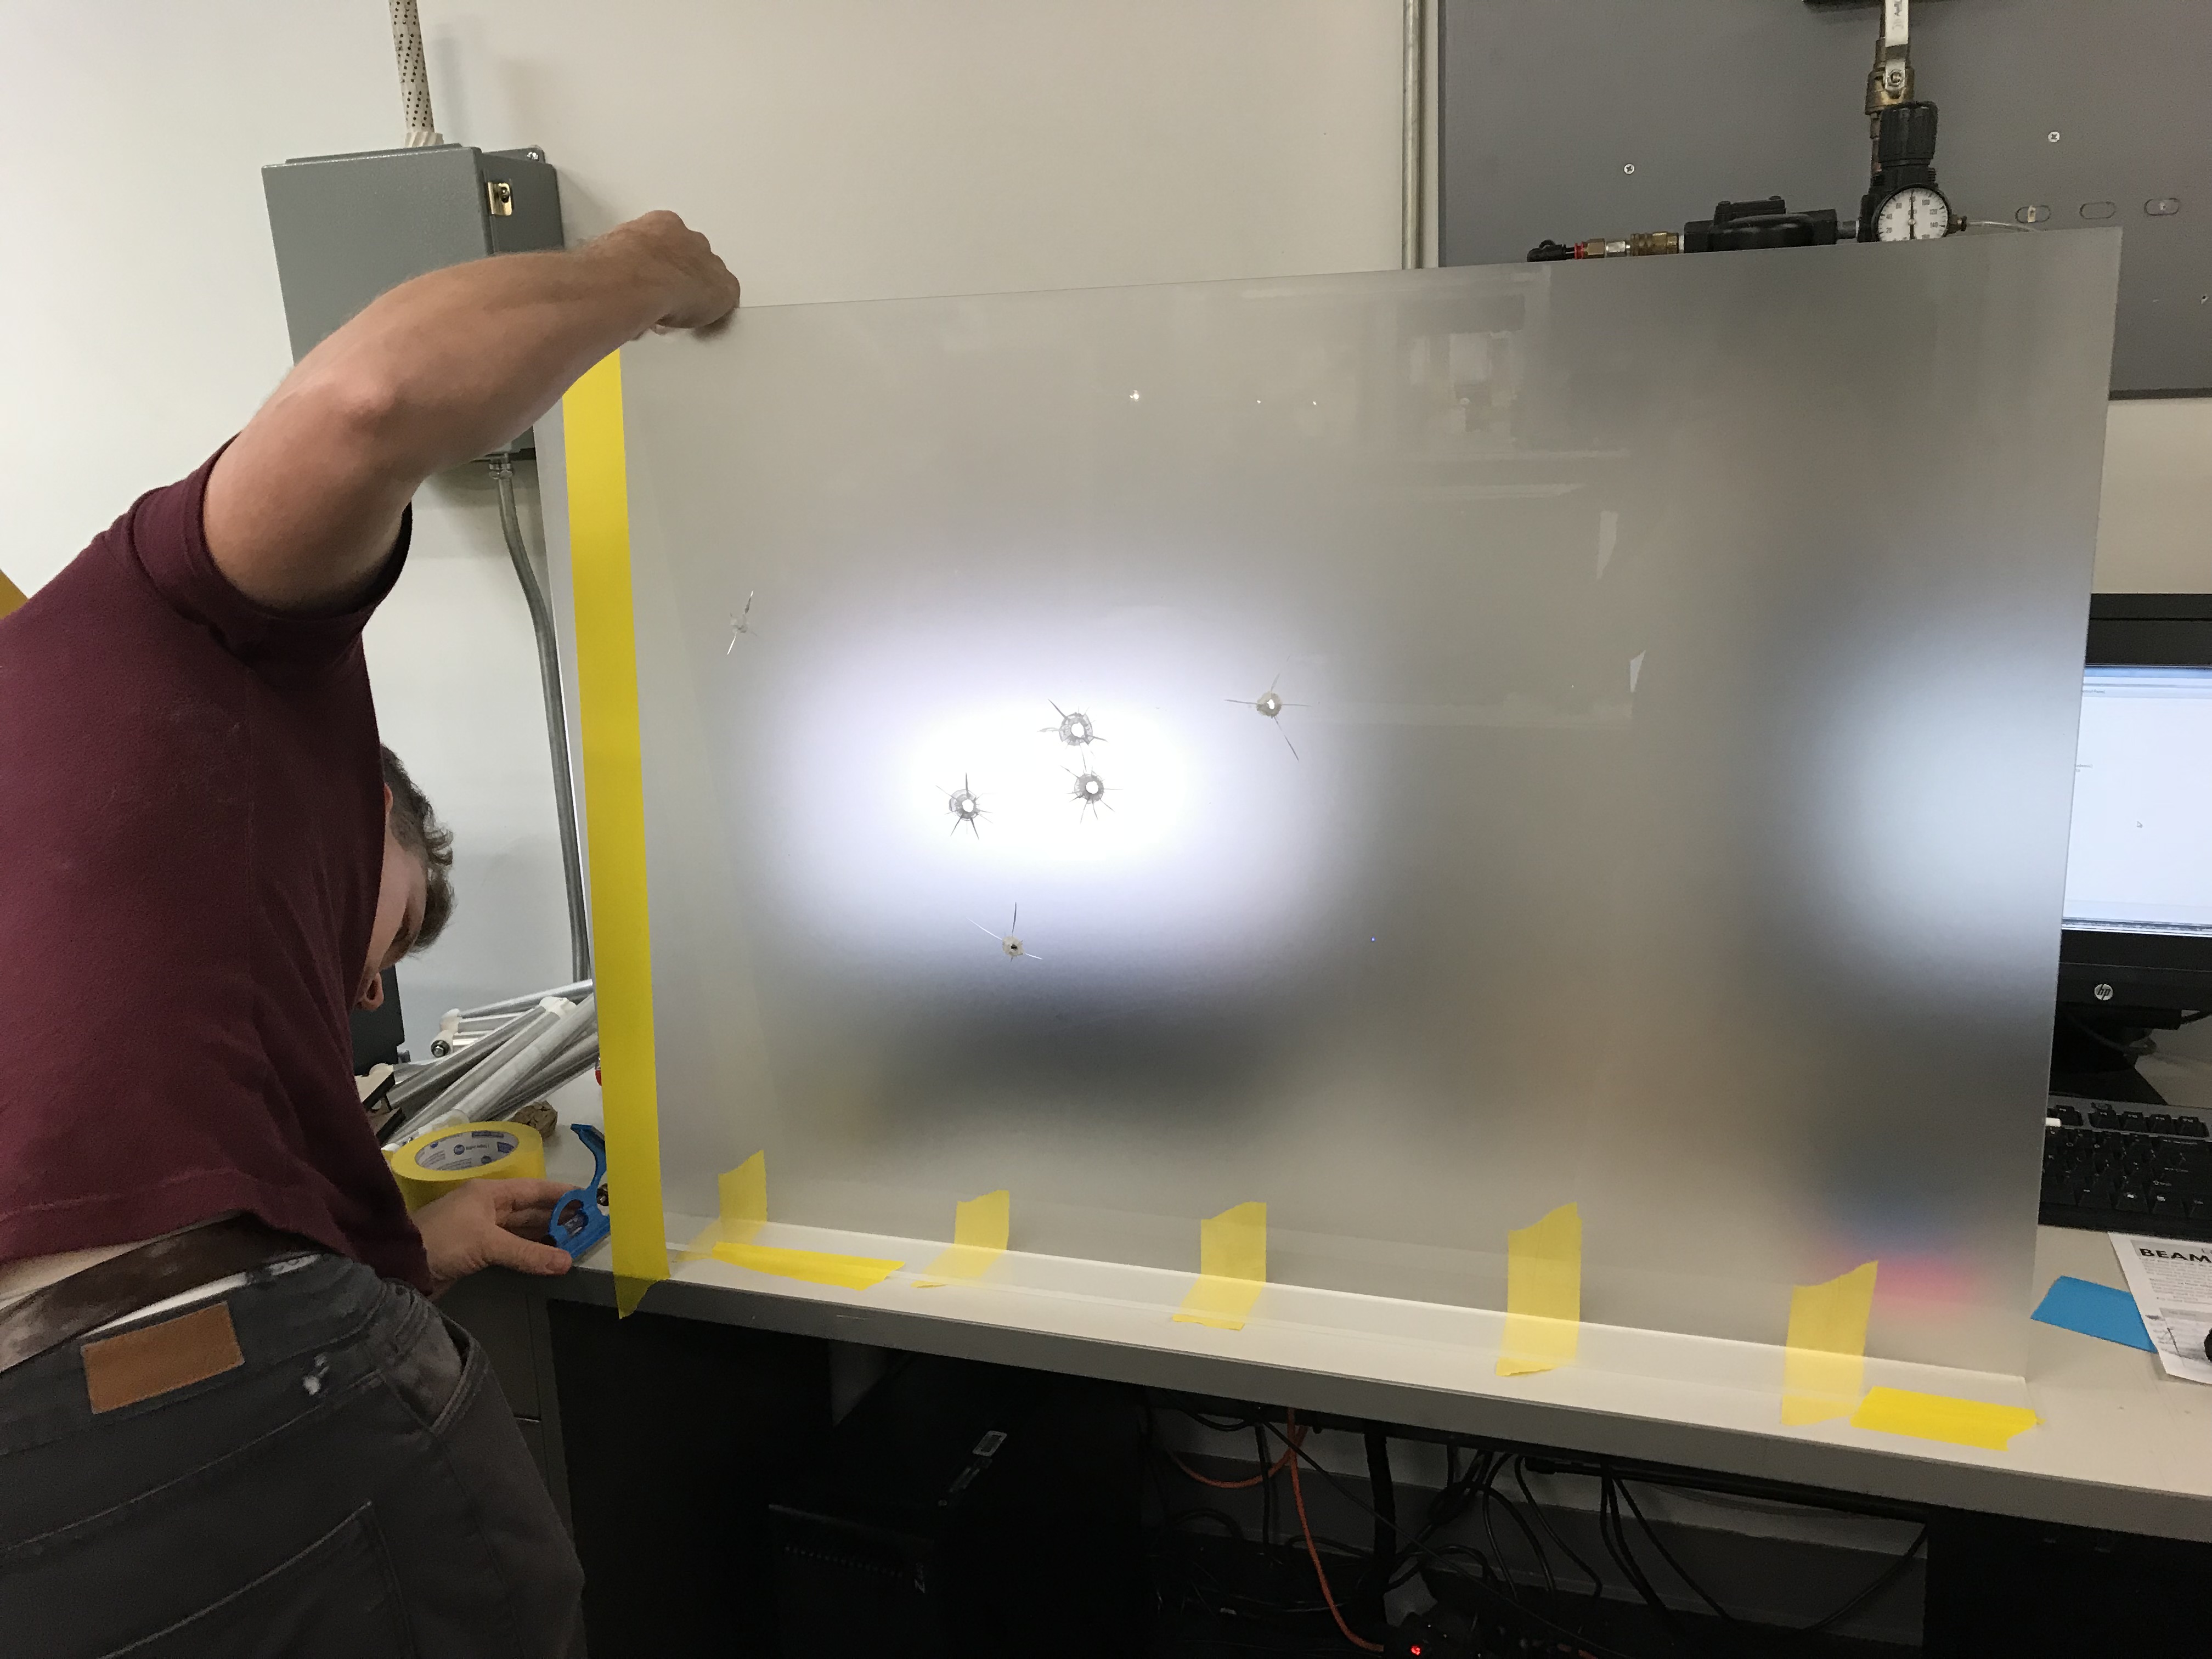
The holes had to be real. A professional shooter fired through the sheet with an AR-15 at an indoor range, and the holes still hold lead and powder residue. They are the only clear places in the acrylic.
Building the frame
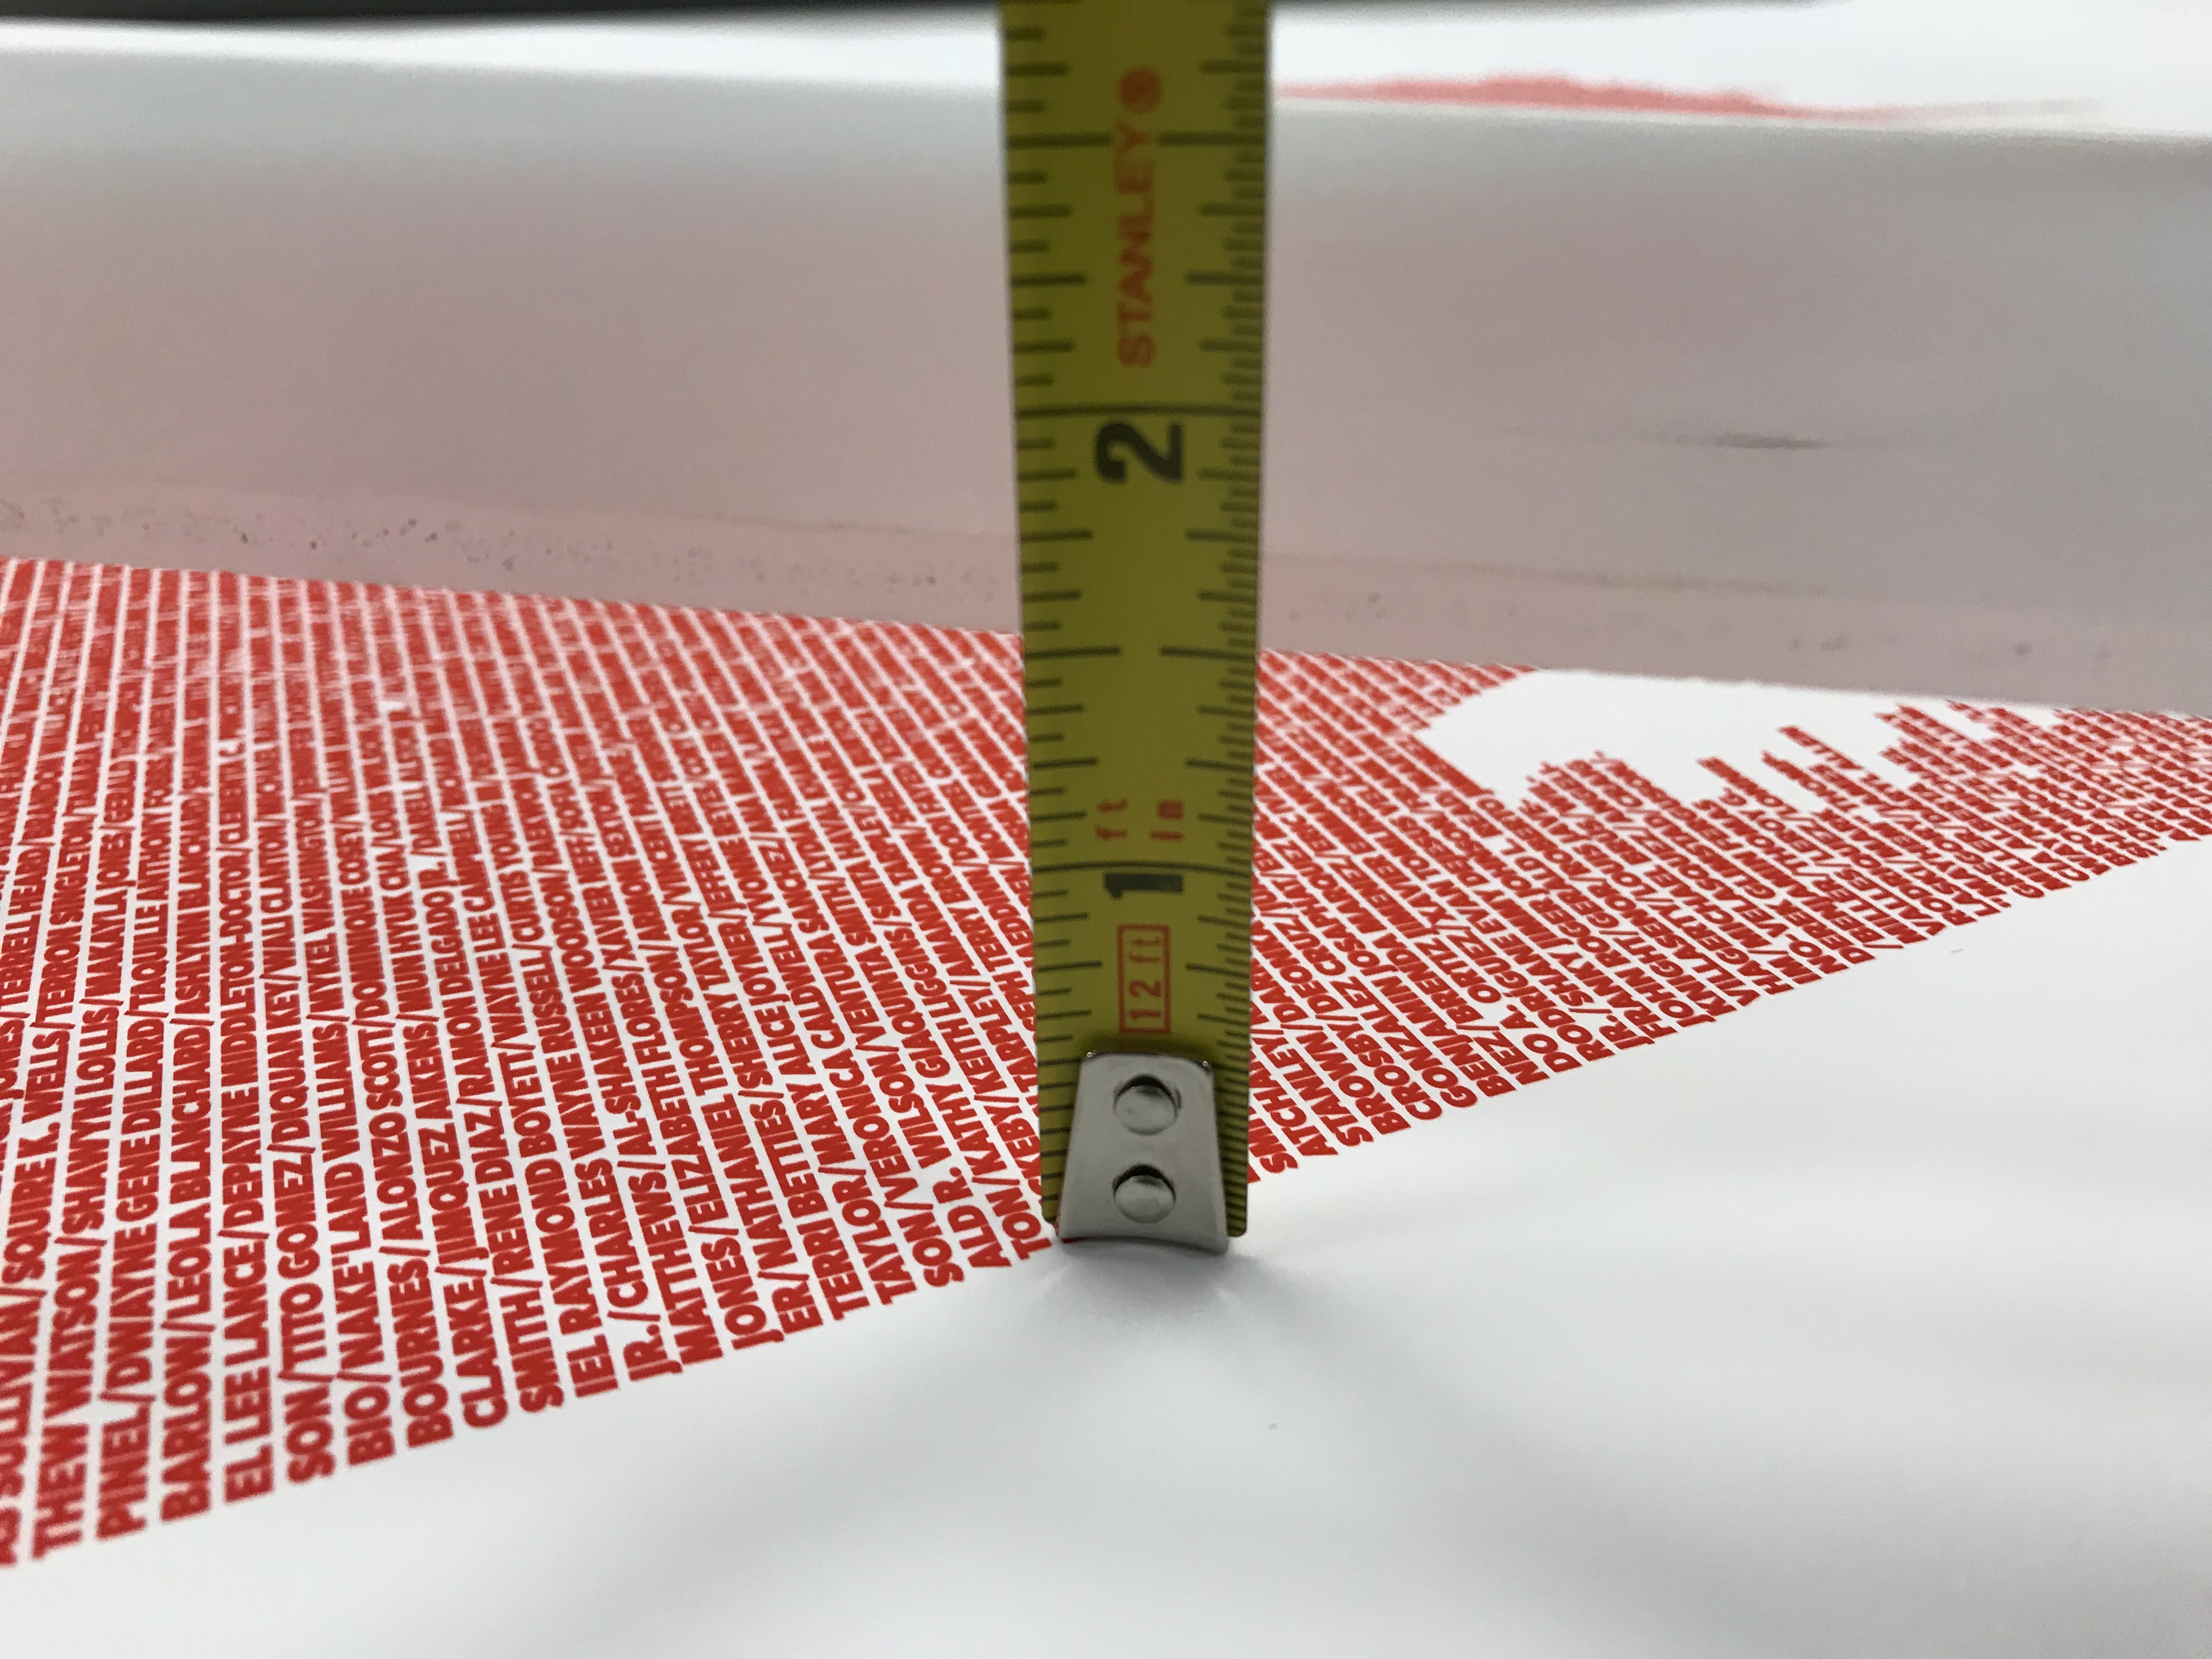
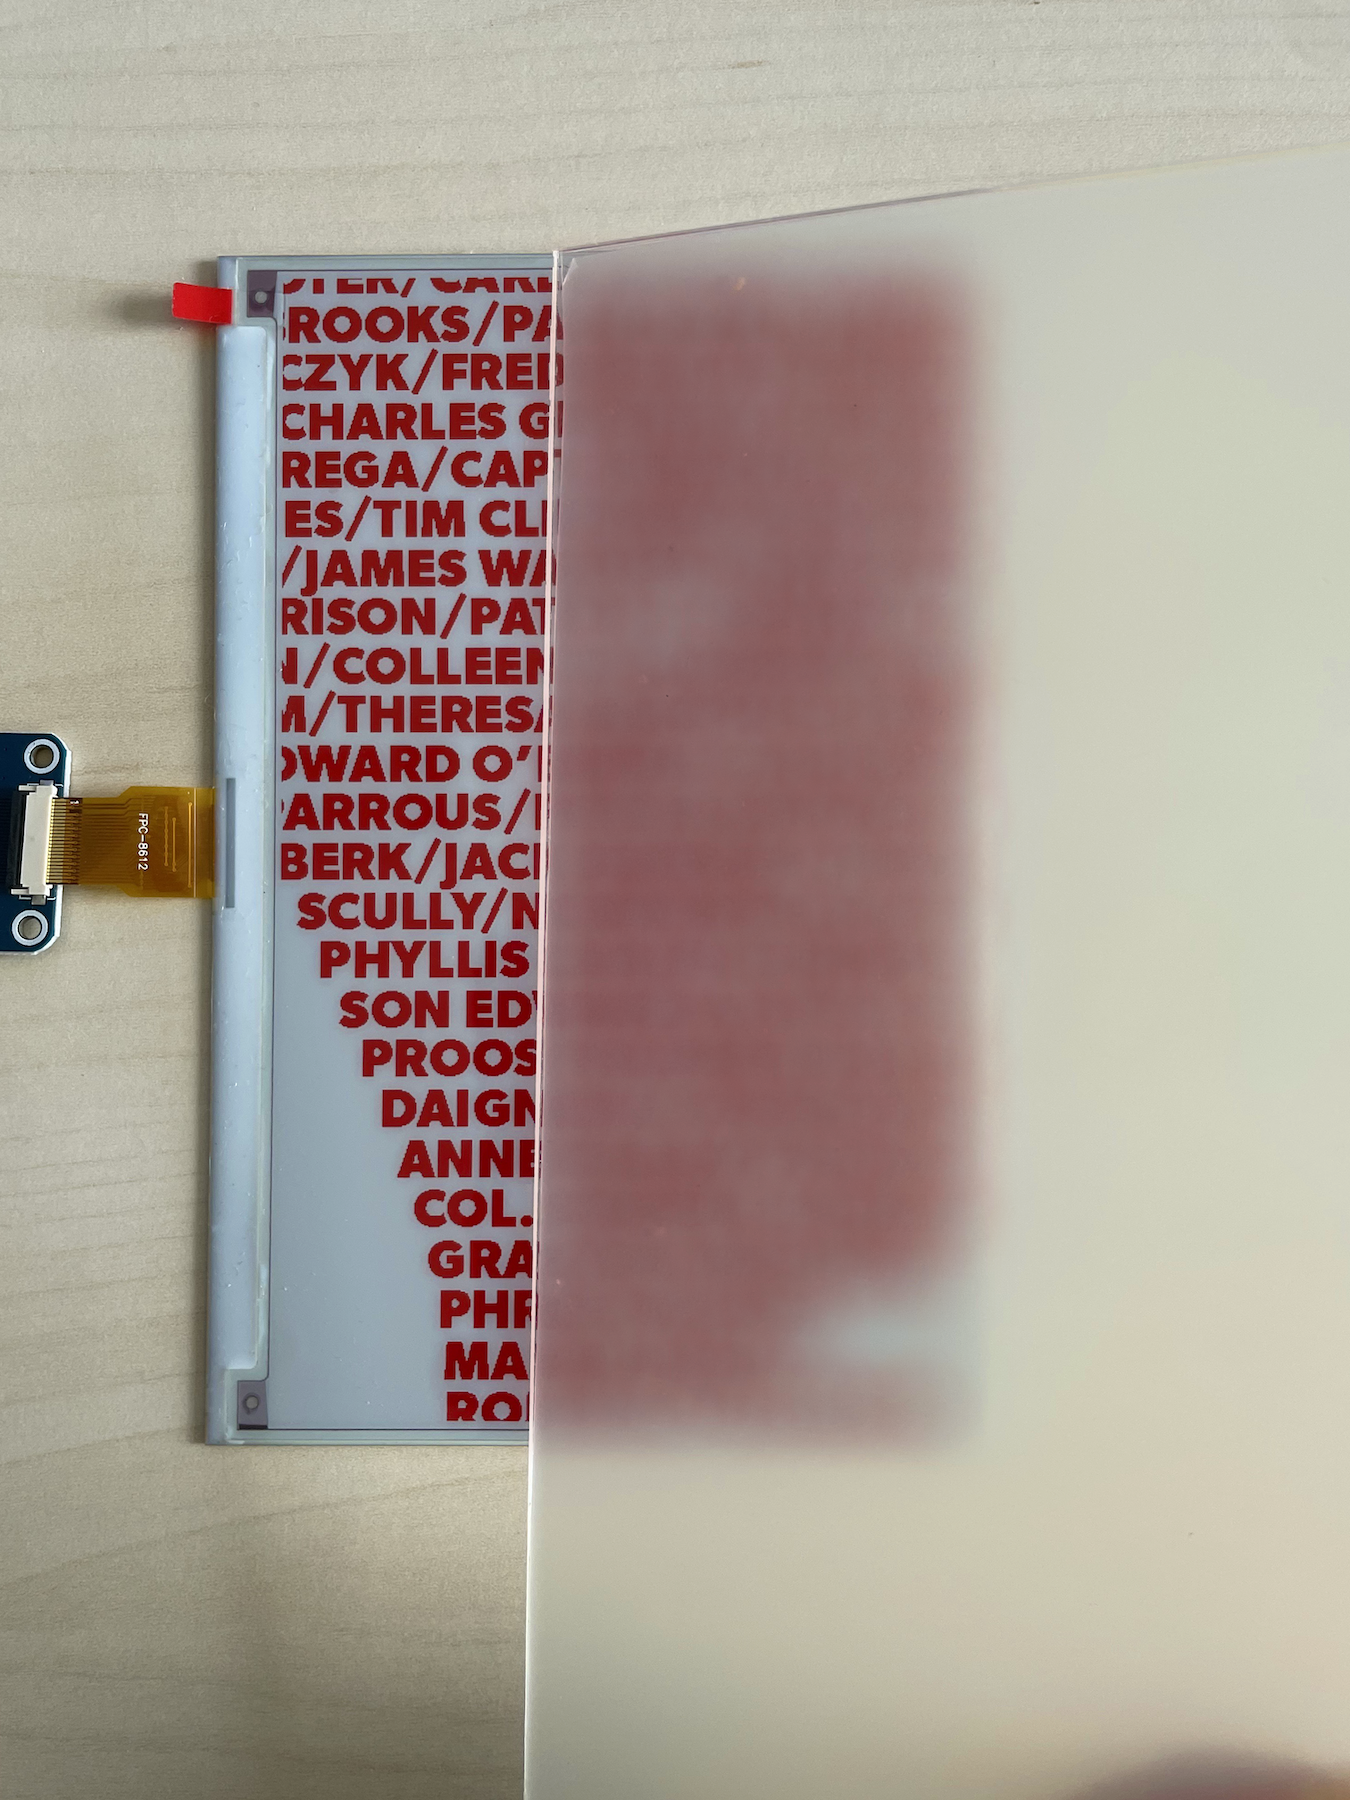
I printed the names on museum-grade, fade-resistant paper and set the frosted sheet a short distance in front of them. That gap turns the type into a stain: the further back the print sits, the softer the red.
The result
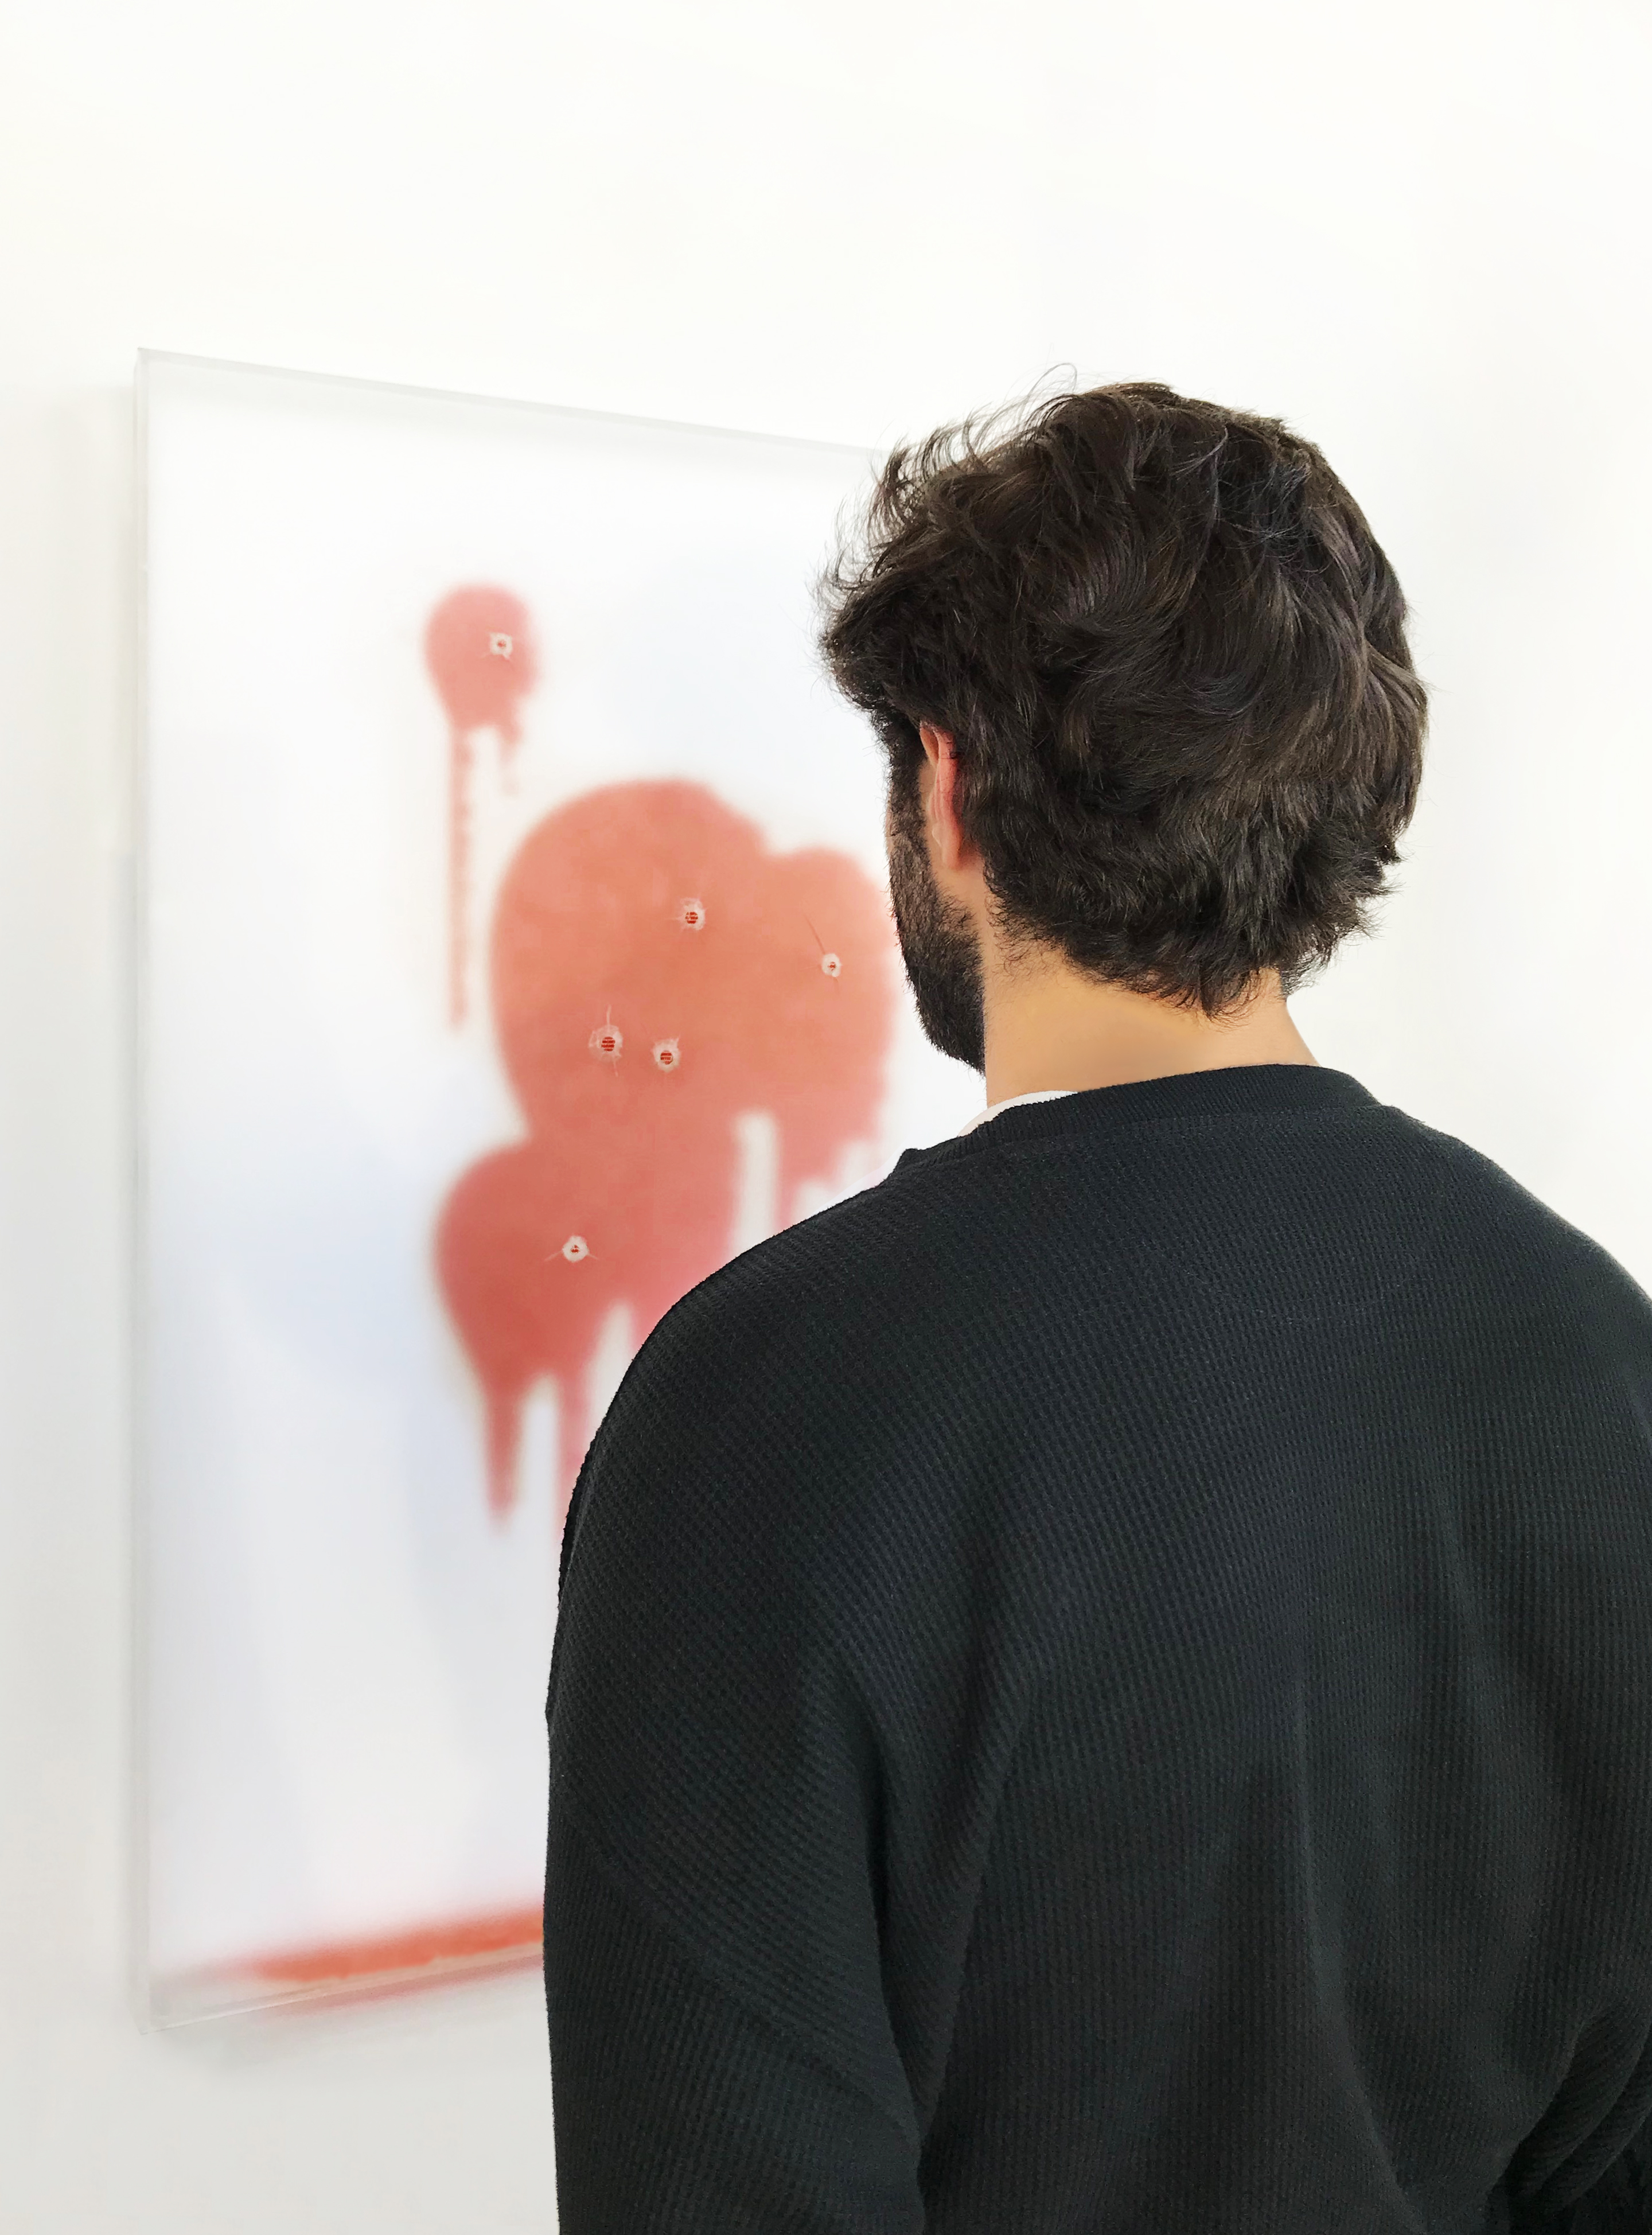
From a few steps away, the piece reads as blood. The names can only be read through the bullet holes, so to find them you have to come close and look through the damage.


Digital proof of concept
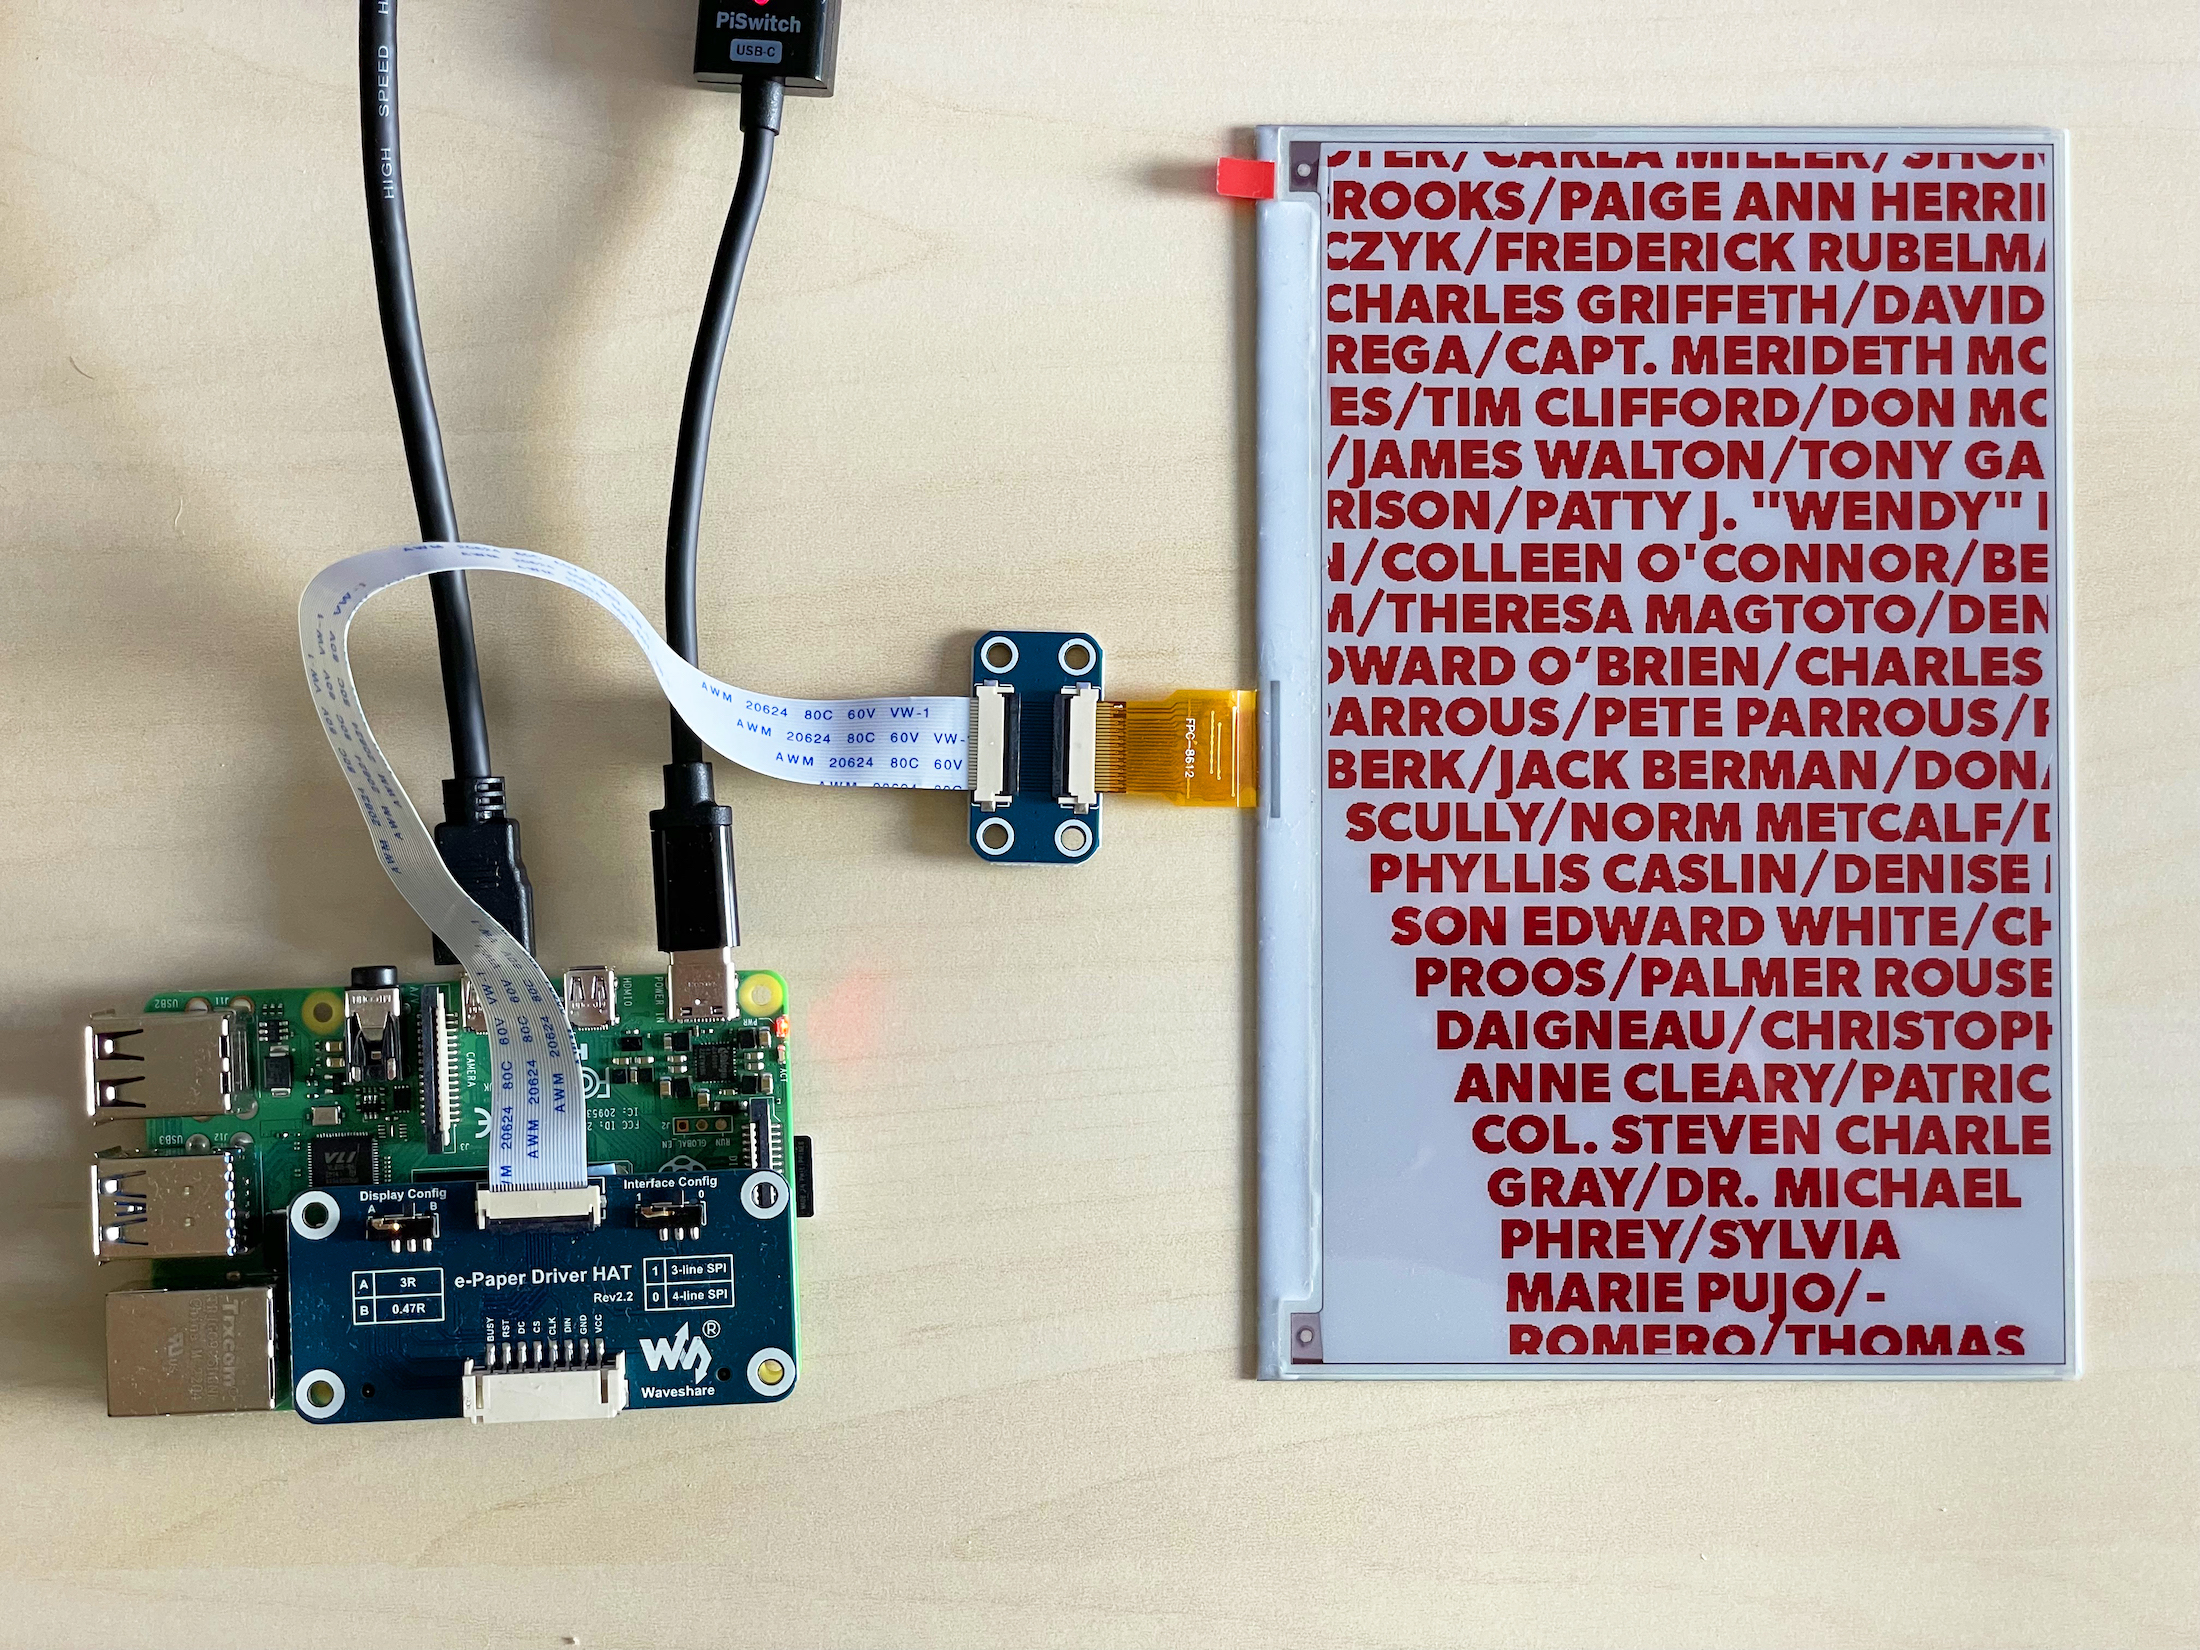
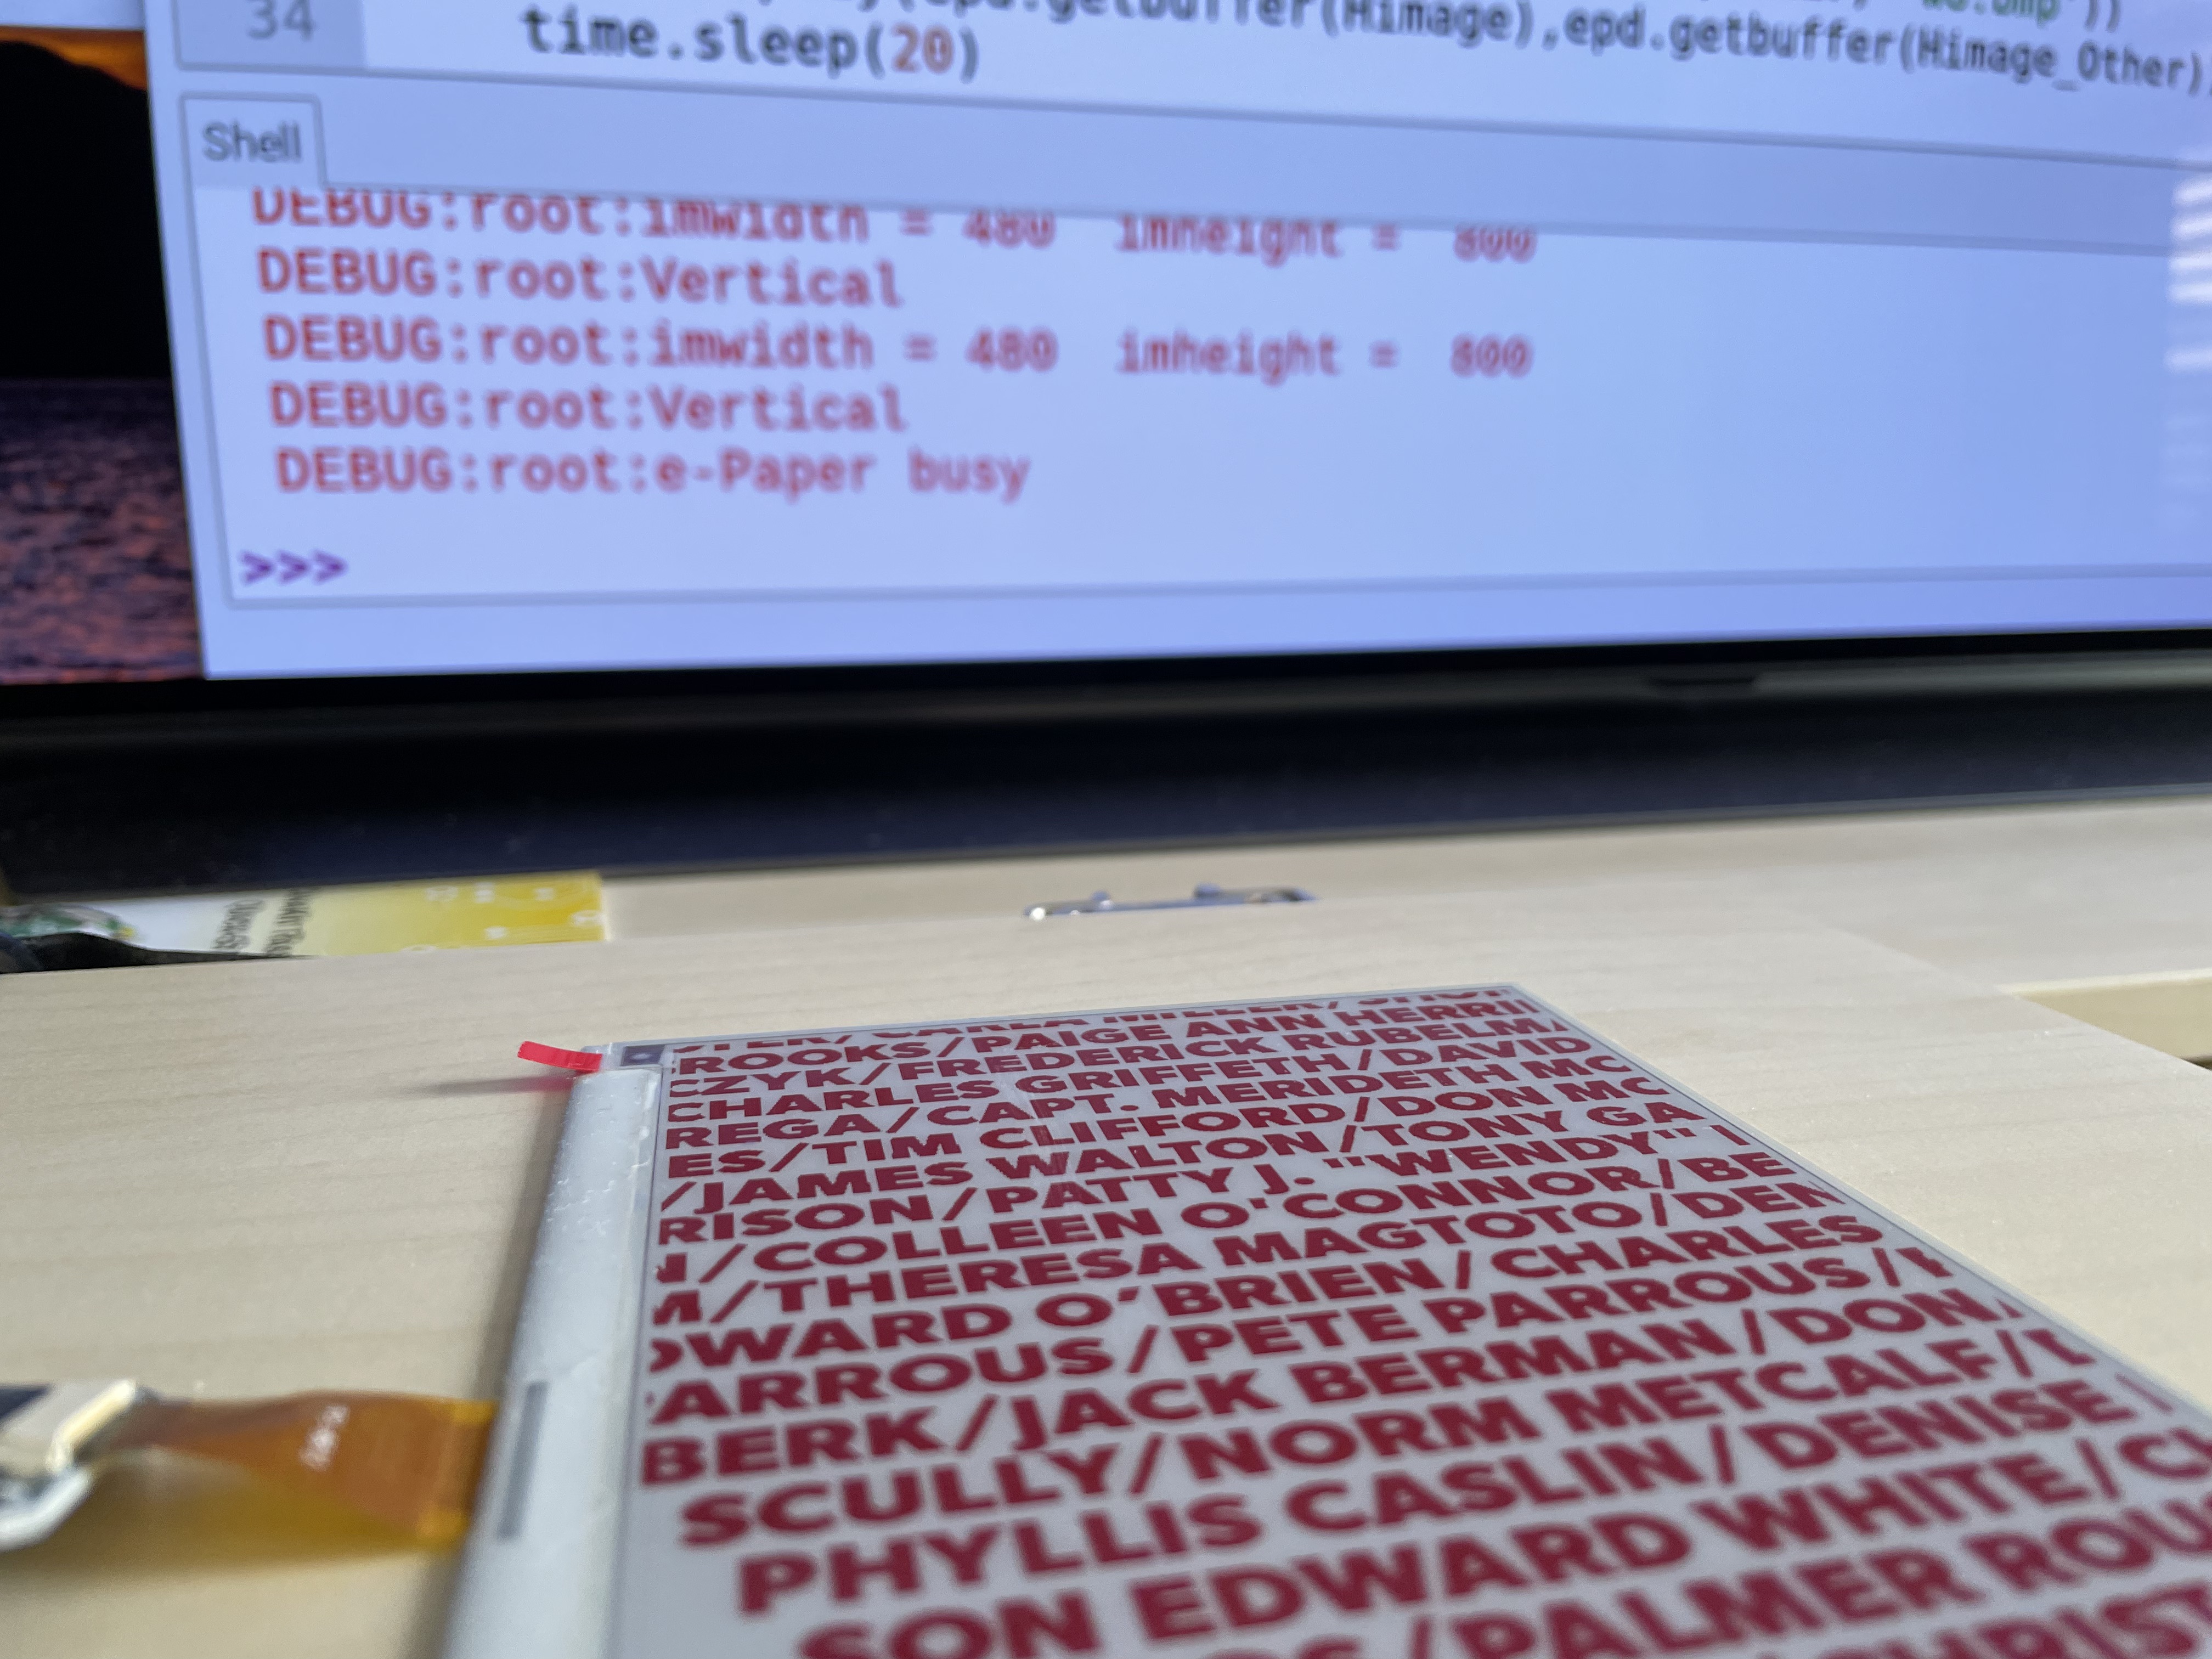
A print is fixed on the day it’s made, and the list keeps growing. In the digital version, the image behind the acrylic is an e-paper display that bleeds new names when a shooting is added to the data.
A Raspberry Pi behind the display runs a Python program once a day. It reads The Violence Project’s database from a Google Sheet, adds anyone new and refreshes the panel. E-paper keeps its image with the power off, so the piece only changes when the list does.
An ongoing process
The prototype left two problems open: keeping the type inside the shape of the blood, and finding a display large enough to hold it.
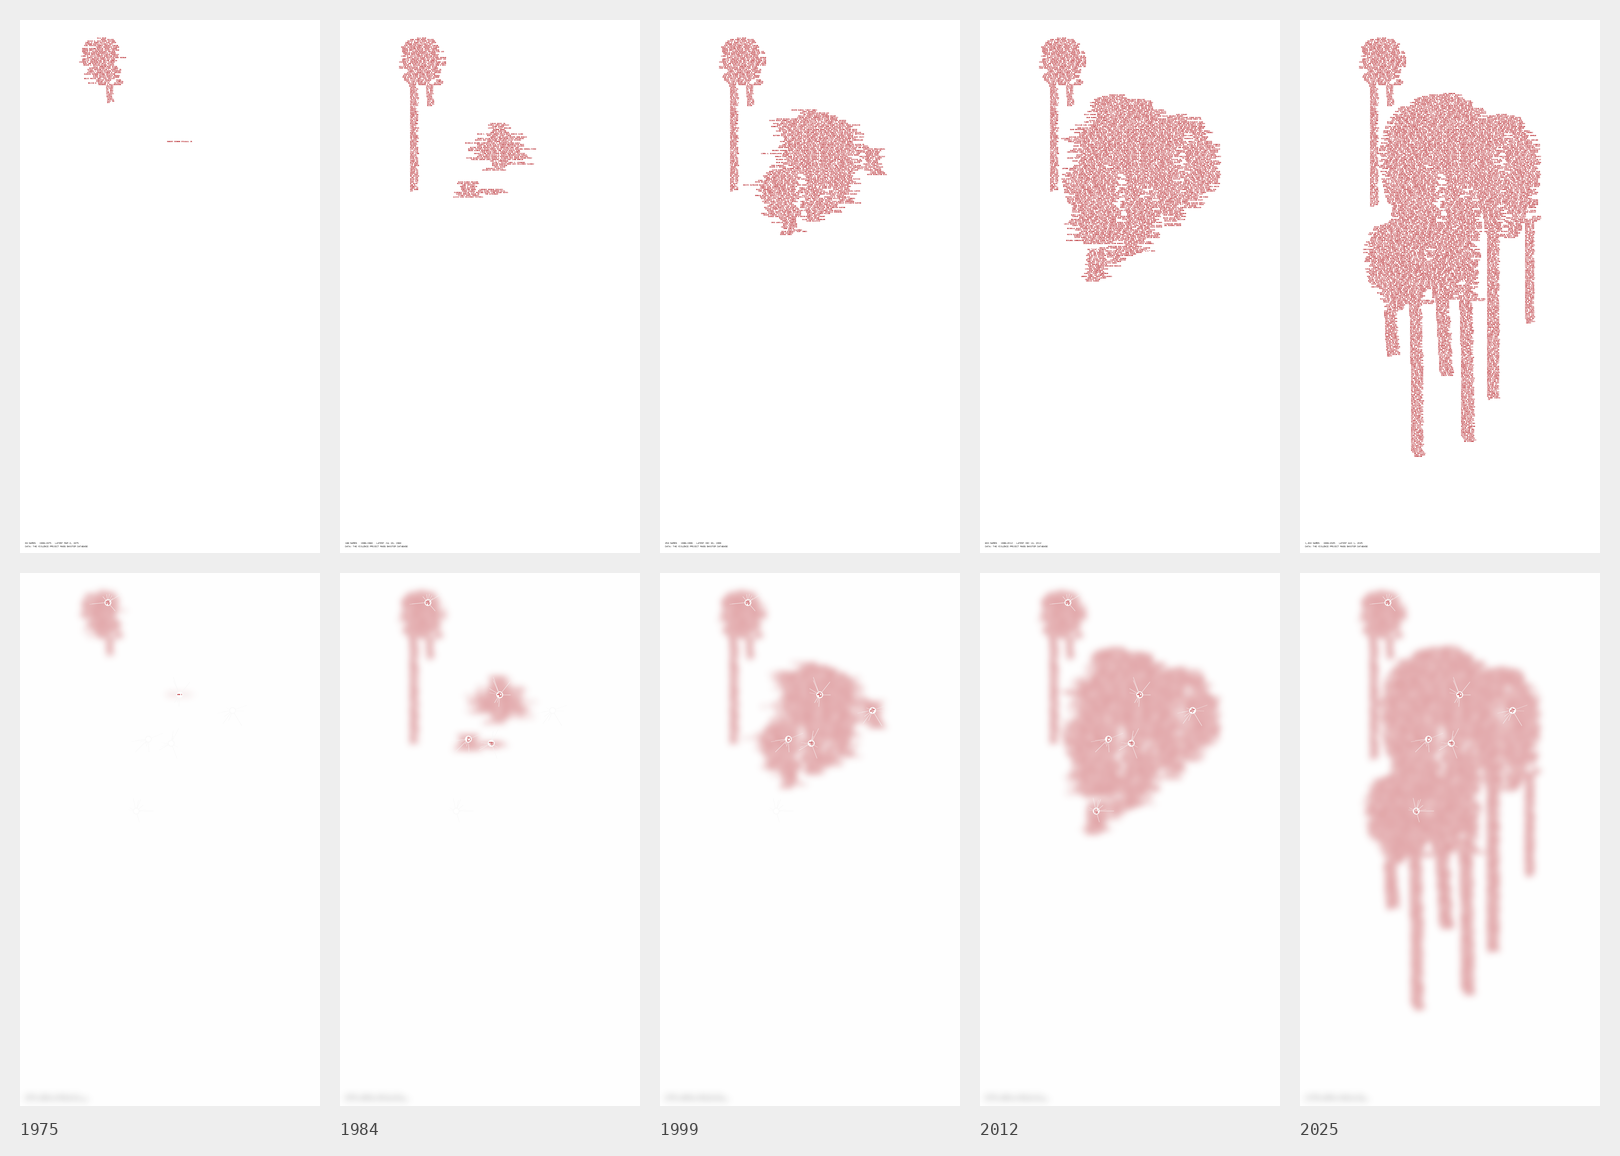
The program on this page solves the first. It traces Final Wounds, my original layout with names up to 2019, and fills it one name at a time, in the order people were killed. Each of the six bullet holes is a wound. The first names gather around the first hole, blotches spread outward from the others, and when a blotch reaches its lower edge, names run down from it in narrow columns, broken and hyphenated the way the original was set. Nothing is erased or moved, so the shape only grows.
Today’s list fills the original design almost exactly. Names added from here on lengthen the runs below it. For the second problem, a 25.3-inch colour e-paper panel is large enough to set the design at its own proportions.
The simulation runs the program’s own layout on the real data, playing from 1966 so you can watch the wounds form. Pause it or run an update the way the Pi does each morning, and follow the code in the window beside it. Move over the panel to look closer.
How it works
The Raspberry Pi behind the panel runs a short Python program every morning:
- FetchDownload the victims table as CSV, from a Google Sheet link or a file on the Pi.
- CompareCheck it against the last run and log any names that were added.
- PlaceAdd each new name at the edge of the red: around a wound, or at the foot of a run. The order is saved, so no one already on the panel ever moves.
- DisplayIf anything changed, redraw the panel in red type and refresh it. Then the panel sleeps until the next change.
- ComputerRaspberry Pi Zero 2 W, running the Python program once a day
- Display25.3-inch colour e-paper panel (E Ink Spectra 6, 3200 × 1800), mounted upright: about 32 × 56 cm. That is large enough to set the Final Wounds design at its own proportions, with the type under 2 mm tall. Panels this size are driven by their own controller board or signage software, so the program saves the image for it
- FrontThe frosted acrylic sheet with the six bullet holes, a few millimetres in front of the panel. The gap sets how much the names blur into blood
- DataThe Violence Project’s victims table, read as CSV from a Google Sheet or a file on the Pi
Because every name stays for good, the type has to be small: under two millimetres tall on the panel, readable only up close. That is the point of looking closer.
The Violence Project publishes a new version of its database about once or twice a year, so the memorial changes when a new version comes out rather than the day after a shooting. Pointing the program at a sheet you update yourself would make it more immediate.
Data and credit
Names and data come from The Violence Project Mass Shooter Database, Version 10 (January 2026), by Jillian Peterson and James Densley.
The database covers mass public shootings as defined by the Congressional Research Service: four or more people killed with firearms, not counting the shooter, at least partly in a public place, and not part of other crimes such as robbery or gang conflict. Years of life lost are the database’s estimates, based on CDC life expectancy data.
The people who carried out these shootings are not named anywhere on this page or in the artwork.
Peterson, J., & Densley, J. (2026). The Violence Project database of mass shootings in the United States (Version 10). https://www.theviolenceproject.org